Section 00
Executive Summary
Global venture capital is at an all-time high in dollar terms and at a multi-year low in deal count. Both things are true at once, and the gap between them is the single most important fact in this report. Q1 2026 alone saw $330.9B in global VC — more than the entirety of 2020 — while the number of companies actually getting funded keeps shrinking. Read the regional sections that follow with that tension in mind: a headline funding number, on its own, now tells you almost nothing about ecosystem health.
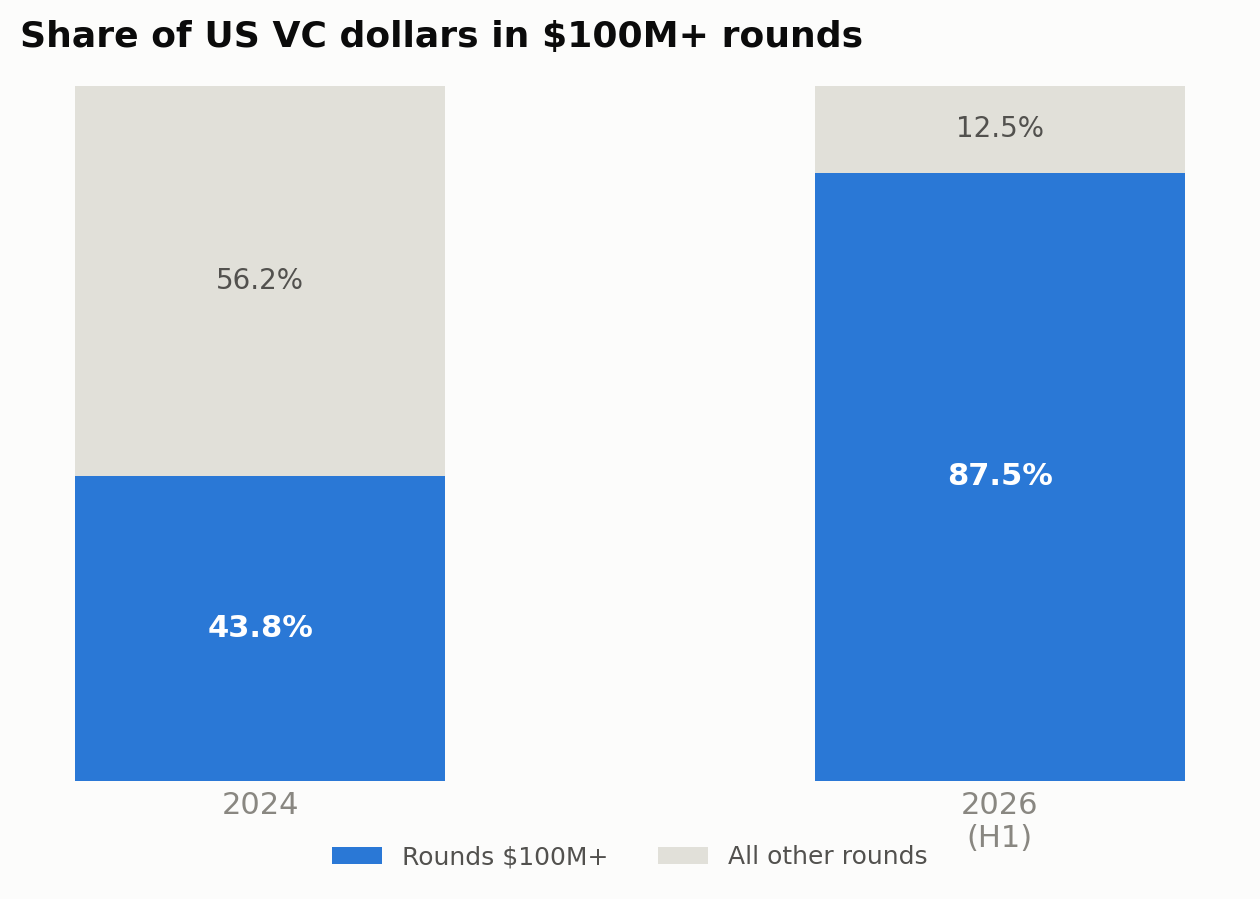
- Capital is concentrating, not spreading. In the US, round sizes above $100M now account for 87.5% of dollars deployed, up from 43.8% in 2024, with deal count essentially flat. OpenAI and Anthropic alone captured 43% of global startup funding in H1 2026. This is not "AI is eating venture capital" — it is closer to "two or three companies are eating venture capital, and AI is the label on the check."
- The AI share of venture dollars (70–86% depending on geography) is a concentration risk, not just a growth story. A correction in frontier-model valuations would flow through almost every regional funding number in this report, since AI infrastructure and frontier labs are now the largest single line item in the US, Europe, and increasingly the Gulf.
- Debt is quietly replacing equity at the venture frontier. In Africa, debt now represents ~41% of tech capital; in climate tech globally, about a quarter of H1 2026 funding was debt, not equity. This is partly discipline (founders and lenders pricing risk more carefully) and partly a symptom — equity investors have gotten choosier, and debt providers are filling the gap at a cost founders will carry through the cycle.
- Physical AI (robotics) and defense tech are the fastest-growing categories in absolute terms — physical AI funding is running at 7x the 2025 pace, defense tech has already exceeded all of 2025 in the first five months of 2026 — but both are early-innings categories with unproven unit economics at scale. Treat the funding velocity as a signal of investor conviction, not of product-market fit.
- Every region except the US and China is still fighting a structural valuation gap. Europe captures 37% of global exit volume but only 11% of exit value. India's 2025 funding ($12B) is still less than half its 2021 peak ($26B). This is the story under the story: outside a couple of hubs, most ecosystems are recovering in deal quality and capital efficiency, not in headline scale — which is arguably healthier, but it changes what "good" looks like for a founder raising there.
- Sovereignty is now a stated investment thesis, not just policy rhetoric. The EU's sovereign AI push, India's deep-tech policy overhaul (20-year eligibility windows, broadened definitions), and Gulf state-backed AI infrastructure spending all point the same direction: governments are underwriting first-loss capital to reduce dependence on US hyperscalers and frontier labs. That is a genuine tailwind for founders building infrastructure, compliance, or defense-adjacent technology in these markets — and a genuine headwind for anyone competing head-on with a US frontier lab.
The sections below cover global financial and technology trends first, then how that capital is being priced and packaged (valuation multiples, business-model shifts), a sector-by-sector use-case scan (fintech, legal tech, proptech, healthtech, enterprise AI), a region-by-region deep dive across the six geographies requested, the structural signals worth watching next, a dedicated risk section, the founder- and company-level data underneath the funding headlines (survival, burn, diversity, pipeline, capital origins), a consolidated region × sector matrix, the real-economy and remaining sectors a pure AI-trends lens usually skips (agriculture, manufacturing, mining, energy, insurance, materials, cybersecurity, space, edtech, longevity biotech), the investor side of the market (fund performance, dry powder, the DPI crisis), an industry-by-region deep dive that pairs five leading sectors per region against trends, named startups, funding and valuations, specific government support programs, and innovation/patent activity, a dedicated look at anomalies, outliers, and emerging patterns in the data, a closing cross-regional synthesis, and an appendix that cross-references this report's coverage against all 191 individually named industries in a standard listed-equity taxonomy, so nothing is silently missing.
Section 1
Global Capital Markets Snapshot
Figures below are drawn from the most recent full-period data available as of September 2026 — a mix of Q1 2026 and H1 2026 reporting depending on the region's typical disclosure cadence. Treat cross-region comparisons as directional, not exact, since methodologies differ across trackers.
| Region | Latest period | Funding | YoY trend | Notable feature |
|---|---|---|---|---|
| Global | Q1 2026 | $330.9B (8,464 deals) | +~150% QoQ | 10 rounds >$2B drove $206B of the total |
| United States | H1 2026 | $412.7B | +30% vs. all of 2025 | AI = 86% of dollars; Bay Area = 68% of Q2 US total |
| Europe | Q1 2026 | $17.6B | +~30% YoY | AI crossed 50% of continental funding for the first time |
| India | FY2025 | ~$12B | Recovering from $7B trough (2023) | Still ~54% below the 2021 peak of $26B |
| MENA | H1 2026 | $1.7B (242 deals) | -18% YoY | UAE alone = 70% of regional capital |
| Africa | FY2025 / H1 2026 | $4.1B (2025) / ~$1.36–3.3B (H1 2026, method-dependent) | +25% (2025) | Debt now ~41% of total tech capital |
| Israel | H1 2026 | $8.6B | +45% YoY | Deal count down 35% — fewer, larger rounds |
Sources: KPMG Venture Pulse Q1 2026; Crunchbase/AI Weekly H1 2026 US data; Crunchbase Europe Q1 2026; Value Add VC India 2026; Wamda MENA H1 2026; Partech/Value Add VC Africa 2025–26; Startup Nation Central / Jerusalem Post Israel H1 2026.
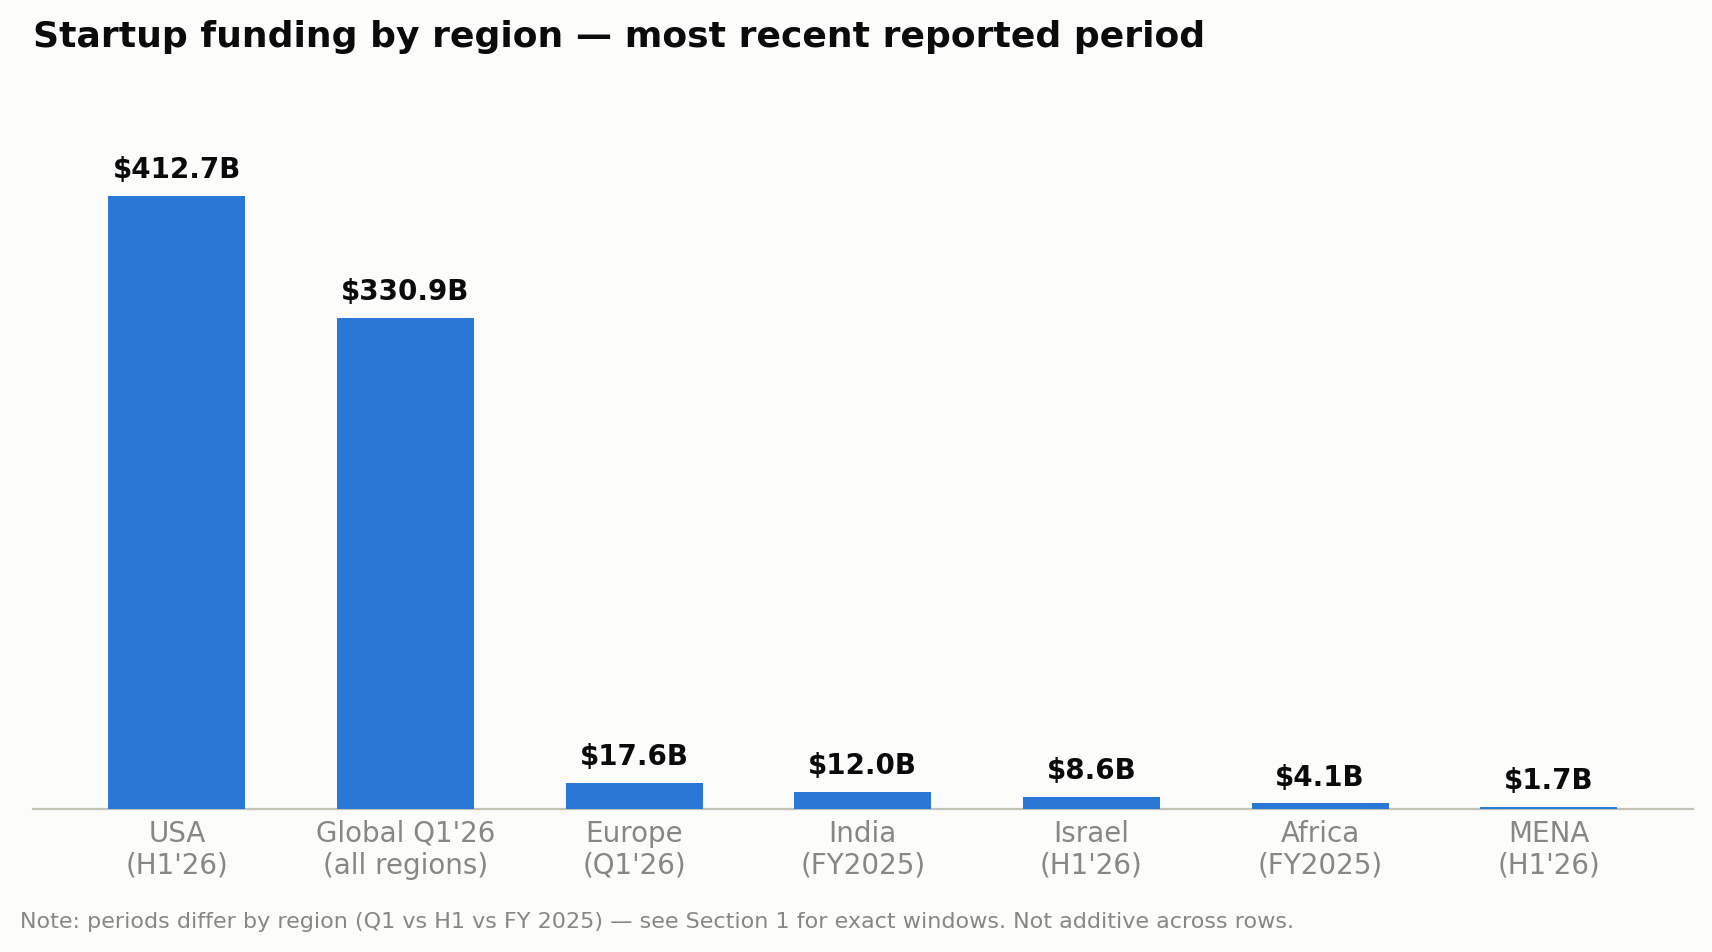
Figures span different reporting windows (Q1, H1, FY 2025) — bars are not directly additive across regions.
1.1 The concentration story, in numbers
- US mega-rounds ($100M+) now account for 87.5% of capital deployed, up from 43.8% in 2024 — the shift is entirely in round size, not round count.
- OpenAI and Anthropic combined captured 43% of all global startup funding in H1 2026; Anthropic's single Q2 round ($65B) was larger than the entire European Q1 2026 total.
- Late-stage capital in the US ($101B in Q2) outpaced early-stage ($31B) roughly 3:1 — a structural headwind for new-company formation even as headline totals hit records.
- The top 10 African ventures captured 65% of H1 2026 value, up from 48% a year earlier, even as equity deal count fell 42%.
- Legal AI shows the same pattern at micro-scale: the top 3 deals captured 58% of all 2026 capital in the category, the top 10 captured 84%.
1.2 IPOs and exits: the window is open, but narrowly
2026 has been the strongest IPO year since the 2021 peak by dollar volume — but it is a handful of enormous, mostly AI-adjacent listings, not a broad reopening.
- US tech IPOs raised $251B across 86 deals through late July 2026 — more than 5x all of 2025 ($47.4B) — but SpaceX's $85.7B raise alone is roughly a third of that total.
- Global exit value hit $413.5B in Q1 2026, the highest since Q4 2021, while IPO count (83 listings) stayed subdued relative to dollar volume — again, a handful of large deals rather than broad market depth.
- Anthropic and OpenAI have both filed confidentially (June 2026); Databricks has explicitly delayed to 2027, with its CEO calling 2026 "a terrible year to go public" outside the AI-infrastructure names — a useful reality check on how selective the window actually is.
- Defense tech is emerging as a second exit corridor: Swarmer's public debut surged over 500%, and roughly 48 defense-sector companies are seen as plausible IPO candidates over the next two years.
Section 2
Cross-Cutting Technology Trends
These are the technology waves showing up as distinct funding categories across every region in this report, roughly ordered by capital velocity.
2.1 Agentic AI — from copilot to execution
The defining shift in enterprise AI in 2026 is from systems that answer questions to systems authorized to act: reviewing invoices and actually messaging customers, not just flagging them; moving money under preset permissions rather than routing every payment through a human. Enterprises report running an average of ~12 AI agents each, but roughly half operate without integration into surrounding workflows — the tooling has outpaced the operating model. Expect "AI governance" (audit trails, permission scoping, human-override design) to become as fundable a category as the agents themselves, since it is the actual blocker to enterprise rollout at scale.
2.2 Physical AI & robotics — humanoids losing share to foundation models
| Period | Funding | Deals | YoY multiple |
|---|---|---|---|
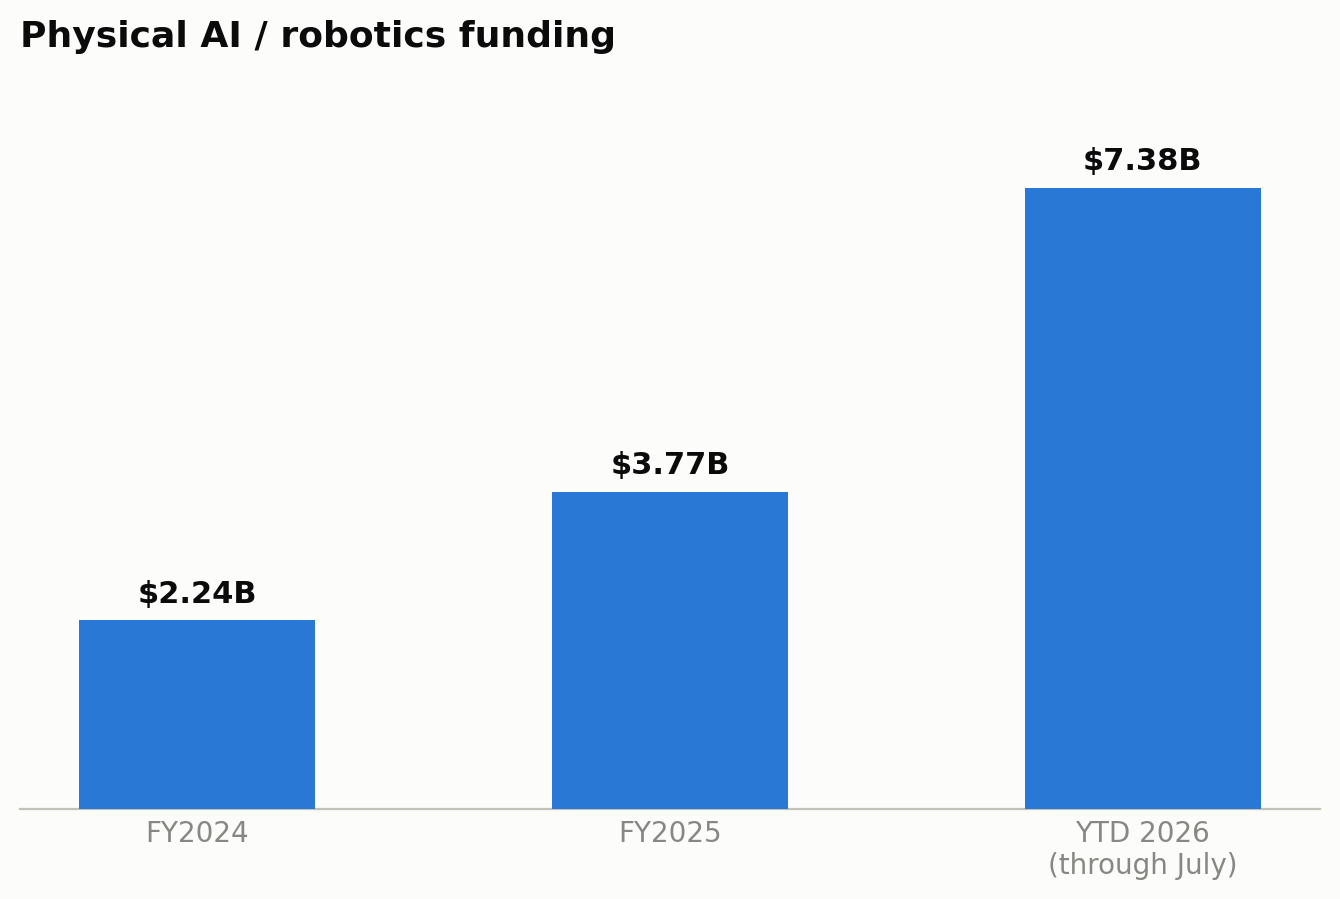
| FY2024 | $2.24B | 15 | — |
| FY2025 | $3.77B | 25 | 1.7x |
| YTD 2026 (to July) | $7.38B | 25 | ~7.1x the comparable 2025 period |
Physical AI funding — excludes autonomous vehicles, defense drones, and surgical robotics.
- Humanoid robots still take the largest single share of capital (43.2%, down from 57.6% a year ago) but are losing relative ground to "robotic foundation models" — general-purpose perception/control software — which shows the strongest capital efficiency of any physical-AI subcategory.
- Notable 2026 rounds: NEURA Robotics (up to $1.4B Series C), Skild AI ($1.4B, >$14B valuation), Apptronik (>$935M Series A).
- Read with caution: 72% of physical-AI deals now exceed $100M, meaning the category's growth is concentrated in a small number of very large bets on unproven commercial deployment — the same concentration pattern seen in frontier-model funding, one layer down the stack.
2.3 Defense tech — the fastest normalization of any category
- 2026 YTD (5 months): $14.6B invested — already ahead of all of 2025 ($9.6B), which itself was more than double 2024.
- Anduril raised a $5B Series H at a $30.5B valuation; Shield AI raised $2B at scale; Saronic (unmanned vessels) raised $1.75B.
- Drivers: Ukraine-driven doctrine shifts, US defense budgets past $900B, AUKUS-related programs, and a broader institutional-investor comfort with defense that didn't exist five years ago (Europe's shift away from ESG exclusions on defense is explicit in the Startup Genome data below).
- This category is now genuinely global — it shows up as a distinct theme in the US, Europe (Munich as an emerging DefenseTech/DeepTech hub), and Israel (see Section 6.6) — making it one of the few sectors where the same capital thesis is playing out on three continents simultaneously.
2.4 AI infrastructure: semiconductors and quantum
Semiconductors: ~$10.7B deployed into chip startups through June 2026, on pace to exceed 2025. Cerebras Systems' May 2026 IPO raised over $5B at a ~$50B market cap (shares have since fallen roughly a third, which is worth noting given the enthusiasm elsewhere in this report). Notable rounds: MatX, Ayar Labs, and Etched.ai each raised at or near $500M for AI-specific chip designs.
Quantum computing: the clearest counter-example to the "everything is up" narrative. 2026 funding ($1.2B YTD) is down from 2025's record ($4.1B) even as public-market enthusiasm stays high — Quantinuum is filing for a Nasdaq listing at a valuation well above its last private round, and four public quantum names carry a combined ~$36B market cap despite no profitability. Private investors appear to be pulling back exactly as public markets get more excited — a divergence worth watching rather than a trend to extrapolate.
2.5 Climate tech — smaller deal count, larger checks, more debt
- $41.3B invested globally in H1 2026, with the largest rounds accounting for nearly 65% of total capital — deal count is at a record low even as dollars hold up.
- Roughly a quarter of climate-tech capital is now debt rather than equity, reflecting capital-intensive infrastructure needs that don't fit a venture-equity return profile.
- The US remains the largest market; China has overtaken Europe as the second-largest destination for climate-tech capital — a geopolitically significant shift given Europe's historical leadership in the category.
2.6 Crypto, stablecoins & tokenization — institutional integration year
- US crypto venture funding: $7.9B, +44% YoY, with median check size up to $5M despite fewer deals — the same barbell pattern as everywhere else in this report.
- Stablecoin-focused funding: $1.5B in 2025, up from under $50M in 2019 — SVB frames dollar-backed stablecoins as becoming "the internet's dollar" for cross-border payments and treasury operations, aided by regulatory clarity (18 OCC bank-charter applications filed in 2025).
- Real-world-asset tokenization exceeded $36B in 2025 — directly relevant to proptech and fractional real estate models (Section 5.3).
- An AI–crypto convergence is emerging as its own thesis: roughly 40 cents of every crypto venture dollar now targets companies building at the intersection of the two (agentic payments, on-chain AI infrastructure).
Section 3
Valuation Patterns & Analysis
Funding totals tell you how much moved. Valuation multiples tell you what the market believes about durability — and in 2026, the gap between AI and everything else is the widest it has been since the dot-com era. This section looks at the multiples themselves, then at the capex-versus-revenue math that determines whether those multiples are earned or borrowed against future demand.
3.1 The AI premium, quantified
| Segment | EV/Revenue range | Approx. median |
|---|---|---|
| Foundation model labs | 30–120x | ~37.5x |
| AI infrastructure / platforms | 15–40x | ~25x |
| AI-native SaaS | 15–30x | ~25x |
| AI application layer (thin wrapper on 3rd-party APIs) | 8–20x | ~15x |
| High-growth public SaaS | 6–12x | ~8x |
| Median public SaaS | 2–6x | ~3.4x |
Approximate ranges compiled from 2026 private and public market comparables; individual deals vary widely.
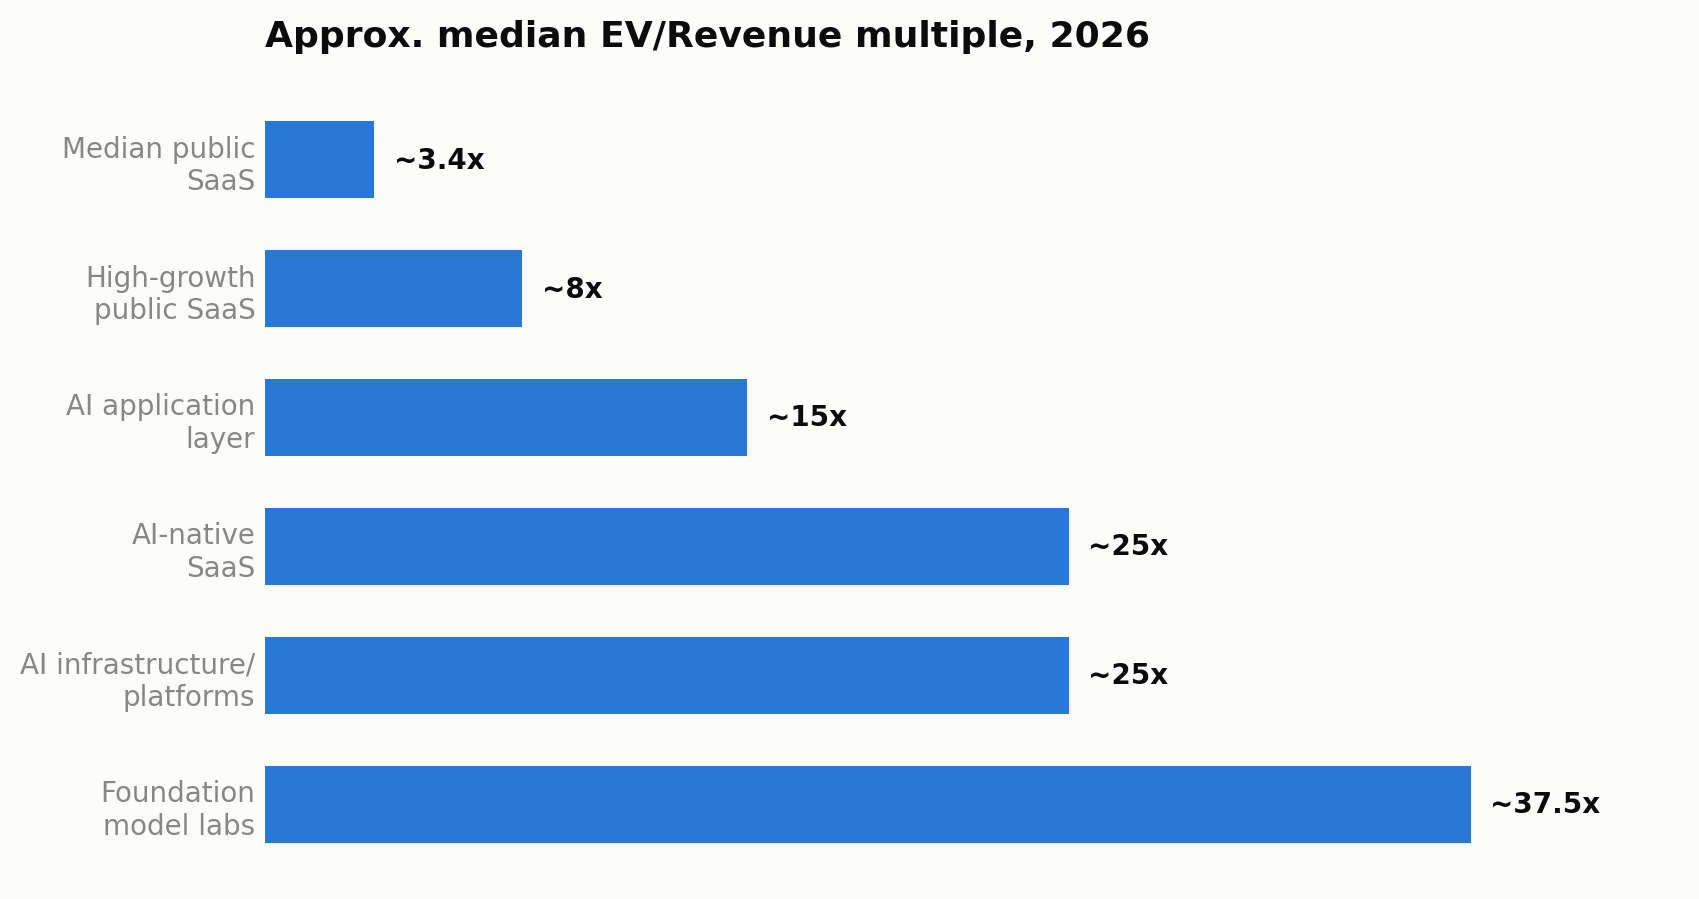
- Foundation-model labs command roughly a 10x multiple premium over median public SaaS — OpenAI scaled from ~$1B to $11.6B in ARR in 18 months; Anthropic went from a $10B run-rate in 2025 to $47B by mid-2026. Multiples this high are a bet on that growth rate continuing, not a reflection of current profitability.
- Four structural drivers explain the gap: (1) foundation models behave as infrastructure layers with winner-take-most economics, not standalone products; (2) strategic checks from Microsoft, Amazon, Nvidia, and SoftBank ($8–50B each) create a valuation floor that has little to do with traditional return math; (3) training-run costs in the hundreds of millions create a genuine capital-intensity moat; (4) growth rates that would be considered anomalous anywhere else in venture are treated as the baseline case here.
- Where the premium compresses: companies built on top of third-party model APIs, without a proprietary model or genuine workflow lock-in, converge back toward ordinary SaaS multiples (8–20x, trending toward single digits) once growth normalizes. Retaining an AI premium past the first few years of hype requires >130% net revenue retention and 60%+ sustained annual growth — a bar most "AI-wrapped" products will not clear. This is the most important valuation distinction in the market right now: the premium belongs to infrastructure and proprietary-model companies, not to every company with "AI" in the pitch.
3.2 The capex-vs-revenue gap behind the multiples
| Metric | 2026 figure |
|---|---|
| Top-5 hyperscaler AI capex (2026 guidance) | $660–725B (+60–75% YoY) |
| Industry-wide AI capex estimate (2026) | ~$765B |
| Cumulative hyperscaler AI capex, 2026–2031 (Goldman Sachs model) | ~$7.6 trillion |
| Current AI-attributable revenue (2026) | ~$50–150B annually |
| Revenue required to justify current capex (Sequoia / JPMorgan) | $600–650B annually, near-term |
| Revenue required by 2030 (Bain estimate) | ~$2 trillion in new annual AI revenue |
- The core test: the gap between what's being spent and what's being earned is somewhere between 4x and 13x, depending on whose model you use. Closing it requires several things to happen simultaneously — enterprise pilots converting to production (currently ~95% of generative-AI pilots don't scale), token volumes rising as fast as inference costs fall (costs are dropping 10–100x, so volume needs to rise roughly 24x by 2030 just to hold infrastructure economics flat), data centers sustaining 70%+ utilization (below 50% risks "telecom-style" writedowns on the hardware), and GPU depreciation schedules of 5–6 years holding — versus the 2–3 year useful life some technologists argue is more realistic given the pace of chip generations.
- Read plainly: 2026 is the year these assumptions get stress-tested, not the year they get proven. None of this means the AI buildout is fake — it means the valuations attached to it are underwritten by assumptions about 2028–2030 demand, not 2026 cash flow, which is a materially different (and more fragile) basis than the multiples table above might suggest at first glance.
3.3 Down rounds, bridges, and where repricing is actually happening
- The down-round rate has genuinely improved: 11.4% of new US rounds priced below the prior round in Q1 2026 (Carta/Cooley), down sharply from a 22% peak in 2023, with an 86% up-round rate in the same quarter.
- But this average hides a stage split: Series B and later saw down/flat rounds combined reach 28% as recently as Q4 2025 (15% down, 13% flat) — later-stage, 2021-vintage companies are absorbing most of the repricing pain, while seed and early-stage look comparatively healthy.
- Bridge financing — a soft signal of runway stress that doesn't show up in "down round" statistics — represented 16.6% of all cash raised on Carta in Q2 2025, up from 11.8% a year earlier. A company bridging isn't captured as distressed by headline funding totals, but the money is doing something different than a normal round.
- Read together with Section 3.1: the market is bifurcating cleanly — AI infrastructure and proprietary-model companies are pricing at record multiples, while a meaningful slice of the 2021–2022 vintage (non-AI, later-stage) is quietly working through down rounds and bridges that don't make the funding headlines. Both stories are true in the same market at the same time.
3.4 The GenAI repricing shock: unicorns falling below $1B
Section 3.3 covers down rounds and bridges as a general phenomenon. One specific, verifiable driver behind a large share of that repricing deserves its own line: GenAI's effect on how the market values headcount-heavy, pre-2023 companies.
- The scale is large and dateable to a specific cause: 220+ of the 857 US unicorns tracked by PitchBook have now fallen below the $1B mark. The damage is vintage-dependent in a way that fingerprints GenAI specifically, rather than a generic funding-cycle correction: 2021-vintage unicorns are down 68% in value on average, 2022-vintage down 52% — precisely the cohorts that raised richest, on pre-ChatGPT cost assumptions, right before the market reset what "capital-efficient" means. Roughly half of all 857 unicorns haven't raised in three years, meaning they're sitting at stale marks nobody wants to price.
- Named casualties span consumer and enterprise alike: Glossier, The Farmer's Dog, Rothy's, Brooklinen, Savage X Fenty, and AG1 on the consumer side; Betterment, SeatGeek, Mercury, and Calendly on the enterprise/fintech side. Enterprise SaaS absorbed the worst of it (~75 companies below water), fintech next (~37–38).
- The mechanism, stated plainly by a practitioner: Khosla Ventures' Samir Kaul put it as "50 engineers do what it would've taken 500 engineers... five years ago." Old, headcount-heavy cost structures got repriced almost overnight once the market believed that math, and $250B+ concentrating into OpenAI and Anthropic alone (Section 1.1) simultaneously starved everything else of follow-on capital — both effects push in the same direction, toward the down-round and bridge-financing data already documented in 3.3.
Section 4
Business Model Shifts
Underneath the sector and technology trends, the actual commercial model startups are selling on is changing — away from seat-based SaaS toward pricing tied to outcomes, actions, or the labor being displaced. This matters more than it sounds: it changes gross margin assumptions, sales cycles, and what a company's ARR figure actually represents.
4.1 From seats to outcomes: the new pricing playbook
- Outcome-based pricing: charging for a result delivered, not a seat occupied. Intercom's Fin AI agent charges $0.99 per fully-resolved customer issue — the customer pays for a solved ticket, not a software license.
- Action/workflow-based pricing: revenue tied to discrete tasks completed. n8n charges per workflow executed; Clay bundles heterogeneous underlying costs into a credit system consumed per action — both are trying to make unpredictable AI inference costs legible to the buyer.
- Hybrid models are becoming the default compromise: a predictable base fee plus a variable usage tail (Relevance AI, Lovable) — giving finance teams a budgetable floor while still capturing upside from heavy users.
- The unresolved problem: buyer value perception hasn't caught up to these models — roughly 8 in 10 companies report using generative AI, yet a similar share report no measurable bottom-line impact yet. Pricing committees (product, engineering, finance, and sales together) are becoming a standing function at AI-native companies specifically because LLM costs fall roughly 10x per year, which means a pricing model set today is very likely wrong again within 12 months.
4.2 "Services-as-software": pricing against headcount, not seats
The more structurally significant shift is business models that price an AI agent against the fully-loaded cost of the human role it replaces or augments, rather than against a software-seat benchmark. This reframes an AI product's addressable market from "software budget" to "services and labor budget" — a much larger pool, but one that requires the product to actually perform at a defensible fraction of human-equivalent output, and typically involves deeper procurement and liability scrutiny than a normal SaaS sale. It shows up first in categories with well-understood, high-volume human-labor benchmarks: customer support (Intercom's Fin), sales development, paralegal/document-review work (Section 5.2), and bookkeeping/collections (directly adjacent to fintech platforms built around AI-native collections and CRM workflows).
4.3 Circular financing as a business-model pattern, not just a risk footnote
A distinct and increasingly important business-model pattern in 2026 is vendor-financed demand: a hyperscaler or chipmaker invests directly in an AI lab, which then commits a large share of that capital back to the investor's own cloud or compute products. This is not new in principle — but the scale is new, and it is now shaping how AI-adjacent startups model demand. (The systemic-risk dimension of this pattern is covered in Section 7.3.) For a founder evaluating a partnership or platform dependency, the practical takeaway is to know whether the demand you're selling into is organic end-customer demand, or a committed-spend obligation nested inside one of these circular arrangements — the two behave very differently if growth decelerates.
Section 5
Sector & Use-Case Trends
Where Section 2 covers underlying technology categories, this section covers the applied verticals — where that technology is actually being deployed and monetized.
5.1 Fintech
- Agentic finance: AI systems moving from answering questions ("which invoices are overdue?") to executing multi-step financial tasks — reviewing, prioritizing, drafting collection messages, updating CRM, flagging cash-flow risk — without a human in the loop for each step.
- Embedded finance is becoming default rather than differentiated: payments, lending, and banking features are now expected inside vertical software (accounting, marketplaces, project management), not offered as a separate fintech product.
- "Contextual capital": financing surfaces automatically at the moment of need (inventory drop, contract win, signed SaaS deal) rather than through a separate lender search — this is the same trend underlying several of Nikhil's own platform concepts (BGL, RupeeLink, AgentCollect) applied at ecosystem scale.
- The "new capital stack": businesses are assembling modular financial ecosystems (bank + fintech + processor + automation + AI) rather than relying on a single banking relationship — a structural opening for infrastructure and orchestration plays, not just point solutions.
- Regionally: India's fintech deal share sits around 25% (anchored by UPI's $2.6T annual transaction volume); MENA fintech captured $708M (51 rounds), the single largest sector regionally; African fintech took 41% of H1 2026 continental funding.
5.2 Legal Tech
- Explosive but narrow growth: YTD 2026 legal-AI funding hit $1.414B across 31 deals vs. $887M/17 deals in the same period of 2025 (+59% capital, +82% deal count) — full-year 2025 was already up nearly 4x on 2024 ($1.858B vs. $480M).
- Document-drafting AI dominates the category (51.6% of capital); legal research tools are a distant but disproportionately capital-efficient second.
- A striking geographic reversal: Europe captured 64.3% of YTD 2026 legal-AI capital, versus North America's 75% share in the same period of 2025 — Legora's $550M Series D (Europe) was the single largest round in the category. This is directly relevant to comparable-jurisdiction plays (India, UAE) building legal-tech infrastructure — European legal AI is proving that non-US legal systems can produce platform-scale companies, not just US-market clones.
- Capital is extremely concentrated even within this fast-growing niche: the top 3 deals took 58% of all 2026 capital, the top 10 took 84%.
5.3 PropTech & Real Estate Tech
- Construction technology (ConTech) is the fastest-growing proptech subsector — $4.8B (32% of 2024 proptech funding), ~45% CAGR, driven by labor shortages and efficiency pressure rather than novelty.
- AI-powered leasing/marketing/property-management tools attracted $3.2B in 2024 and remain the most active funding area within the vertical.
- Tokenization is moving from thesis to infrastructure: real-world-asset tokenization broadly exceeded $36B in 2025 (Section 2.6, revisited as a financing pattern in Section 7.2), and fractional/tokenized real estate platforms are widely expected to see a funding surge through 2026–27 as regulatory clarity around digital securities improves in the US, EU, and UAE — directly relevant ground for PropToken OS and PrimusProp.
- The overall proptech market is projected to reach ~$119B by 2032 at a 15% CAGR — a large but slow-compounding category compared to the AI-native verticals elsewhere in this report.
5.4 HealthTech & Biotech
- US digital health: $7.4B across 244 H1 2026 deals (up from $6.4B in H1 2025); biotech separately raised $9.1B+ across 68+ companies — the strongest H1 for biotech since 2022.
- Clinical AI investment (OpenEvidence's $250M Series D) favors tools that assist point-of-care decisions over tools that attempt to replace physicians — a clear signal on where regulators and buyers currently draw the line.
- AI-native drug discovery is attracting dedicated capital vehicles (Dimension Capital's $800M third fund) on the thesis that ML can meaningfully compress the traditional decade-plus, nine-figure drug development cycle.
- Enterprise adoption inside health systems remains genuinely early despite the funding enthusiasm: only 30% of US health systems have deployed generative AI at scale in select functions, and just 2% organization-wide — a useful check against assuming funding velocity equals deployment reality.
5.5 Enterprise AI & Coding Agents
AI coding agents and "vibe coding" tools have moved from novelty to default developer workflow at a subset of enterprises in 2026, but adoption is uneven: enterprises report running AI agents across an average of a dozen functions, yet roughly half of deployed agents still operate in isolation rather than as part of an integrated workflow. The gap between agent proliferation and agent orchestration is itself becoming a funding thesis — expect "agent management/governance" platforms to be a distinct, fundable category through 2027 rather than a feature of existing AI products.
Section 6
Regional Deep Dives
6.1 India
India's ecosystem is in a genuine but partial recovery: 2025 VC funding of ~$12B is roughly 70% above the 2023 trough ($7B) but still less than half the 2021 peak ($26B). The read from most trackers is that this is a structurally healthier recovery — driven by capital efficiency and defensible unit economics rather than growth-at-any-cost — even though the headline number looks modest next to 2021.
Sector mix (share of deals, 2025)
| Sector | Share of deals |
|---|---|
| Fintech | ~25% |
| B2B SaaS | ~20% |
| Consumer internet & e-commerce | ~18% |
| Deep tech & AI-native | ~15% (fastest-growing) |
| Healthtech | ~10% |
- 108 unicorns nationally; 9 new unicorns minted in 2025; 1,350+ deals across the year.
- UPI processes $2.6T in annual transaction volume, still the structural backbone under India's fintech deal share.
- Top active funds: Peak XV Partners ($2.85B Fund IX), Accel India ($650M Fund VIII), Elevation Capital ($670M Fund VII), Matrix Partners India ($550M Fund VI).
- Deep-tech policy overhaul (2026): government support eligibility extended to 20 years to match long science/engineering development cycles, and the definition of "deep tech" broadened — Gujarat became the first Indian state with a dedicated space-tech policy, and IT ministry statements point to expanding chip, space, and deep-tech capital support through 2026.
- Notable companies: Zepto (quick-commerce, $5B valuation, $1B+ ARR within three years), Sarvam AI (Indic-language LLM), Groww (~$5B pre-IPO valuation, 100M+ registered users).
- Critical read: India's deep-tech push is real but early — the policy signal (20-year eligibility, broadened definitions) is ahead of the capital signal (deep tech is still only ~15% of deal share). For a founder positioned across fintech, real estate, and legal-tech infrastructure in India, the more immediate opportunity is B2B SaaS and fintech infrastructure, where deal share and capital availability are already large; deep tech is a multi-year bet on policy translating into follow-on private capital, not yet a liquid market.
6.2 United States
The US is both the clearest growth story and the clearest concentration-risk story in this report. $412.7B deployed in H1 2026 (already 30% above all of 2025) is a genuine record — but 86% of it is AI, 68% of Q2 dollars went to the Bay Area alone, and OpenAI plus Anthropic alone took 43% of global (not just US) startup funding.
- Top 3 VCs by H1 2026 deployment: Andreessen Horowitz ($14.2B), Founders Fund ($10.6B), Thrive Capital ($10B) — together nearly half of all H1 fundraising.
- Late-stage ($101B in Q2) outpaced early-stage ($31B) roughly 3:1 — a genuine structural headwind for new-company formation, masked by the headline totals.
- US fundraising by VC firms hit $47.8B in Q1 2026 alone, already exceeding all of 2025's $66.7B pace — LPs are re-committing to the asset class specifically on the AI thesis.
- Critical read: the US market is currently a story about roughly a dozen companies, not thousands. Any founder benchmarking against "US VC is booming" headlines should look past the aggregate number to where money is actually flowing — infrastructure and frontier labs, overwhelmingly — before assuming the same tailwind applies to a vertical SaaS or services business outside that narrow band.
6.3 European Union / Europe
Europe's 2026 story is a genuine, if concentrated, recovery paired with an unresolved structural problem: the region generates 37% of global exit volume but captures only 11% of exit value — companies exit in Europe, but the big outcomes still tend to happen (or get valued) elsewhere.
- Q1 2026 funding: $17.6B, +~30% YoY, second consecutive quarter of growth — but deal volume fell 40% YoY over the same period; seed deals fell 44%, early-stage fell 30%. Growth is entirely a story of larger checks to fewer companies.
- AI crossed 50% of continental funding for the first time in Q1 2026 ($9.2B) — the same concentration dynamic as the US, one step behind in intensity.
- Ecosystem value leaders: London ($438B ecosystem value, 72 unicorns) remains dominant; Paris ($169B, 37 unicorns, now the second-largest AI ecosystem globally at $20.2B); Berlin ($89B, 20 unicorns); Munich emerging fast as a defense/deep-tech hub (+330% AI-ecosystem growth).
- DefenseTech is Europe's fastest-growing sector after AI — ~60% Series A value growth and 15% deal-count growth over the past year, with the Ukraine conflict cited as having fundamentally shifted investor sentiment away from prior ESG-driven exclusions on defense investing.
- Policy tailwinds: "EU Inc." (the 28th legal regime) targets 48-hour, fully digital company formation for under $116 with no minimum capital, rolling out 2027; France's France 2030 programme allocates $1.7B/year to startups; the European Investment Fund is launching a $17.5B fund-of-funds; the European Commission's Scaleup Europe Fund targets $5.8B in direct equity across AI, quantum, semiconductors, and robotics.
- Sovereign AI is now an explicit, funded thesis — national programs (UK's Sovereign AI cohort, Germany's WIN, France's Tibi, Poland's PFR) are using government first-loss capital to seed AI infrastructure independent of US hyperscalers; smaller sovereign-AI infra startups (e.g., Sweden's Berget AI) are raising specifically on this thesis.
- Critical read: Europe's recovery is real but narrow and policy-dependent. The exit-value gap (37% of volume, 11% of value) hasn't closed — it means European founders still often need a US or cross-border exit path to realize full value, which is exactly the kind of gap a genuinely cross-border market-access model is built to address.
6.4 EMEA (Gulf / MENA)
MENA funding actually declined 18% YoY in H1 2026 ($1.7B vs. $2.1B), driven mostly by a sharp Saudi pullback (-81% YoY) after an unusually strong 2025 — but the UAE more than compensated, growing 125% YoY to capture 70% of all regional capital.
| Market | H1 2026 funding | Deals | YoY |
|---|---|---|---|
| UAE | $1.2B | 83 | +125% |
| Saudi Arabia | $259M | 80 | -81% |
| Egypt | $158.9M | 29 | -11% |
- Sector mix by capital: fintech ($708M, 51 rounds) dominant; logistics ($315M); proptech ($241M, 18 deals) — a notably sizeable proptech share relative to other emerging regions.
- Financing structure is shifting toward equity: debt fell from 44% of regional capital (H1 2025) to 29% (H1 2026) — the opposite direction of Africa's trend, suggesting MENA investors are regaining equity-risk appetite even as total dollars fall.
- B2B models led with $763.5M across 140 deals — a stronger enterprise/B2B tilt than most emerging regions in this report.
- A gap worth naming plainly: male-founded companies captured 95% of MENA capital ($1.6B); female-founded startups received just $2.5M (0.14%) of the total. This is one of the starkest funding-gap figures in the entire dataset and is worth flagging to any investor or platform operating in the region, rather than glossing over.
- Critical read: the UAE's dominance (70% of regional capital, +125% YoY) is now so pronounced that "MENA" is functionally becoming shorthand for "UAE plus a long tail." Saudi Arabia's -81% swing shows how thin and lumpy the region's late-stage deal flow still is — one or two mega-rounds move the whole country's YoY number. Given the M3M and cross-border platform work already in motion, the UAE's proptech and fintech pull, alongside its openness as a supply-side market for the cross-border access platform, looks like the more durable regional bet than Saudi Arabia's currently volatile trajectory.
6.5 Africa
Africa's funding recovery (2025: $4.1B, +25% YoY) is real in dollar terms but masks a much rougher underlying picture: equity deal count is collapsing even as totals rise, and debt is now nearly as large a funding source as equity.
| Metric | 2025 / H1 2026 |
|---|---|
| Total funding (2025) | $4.1B (+25% YoY; still well below the 2022 peak of ~$6.5B) |
| Equity | $2.4B across 462 deals (+8%) |
| Debt | $1.6B across ~107 deals (+63%) — now ~41% of total tech capital |
| H1 2026 equity deal count | 146 deals, down 42% YoY (vs. 252 a year prior) |
| H1 2026 median deal size | $1.7M, up 235% YoY |
| Top-10 concentration (H1 2026) | 65% of value, up from 48% a year prior |
- "Big Four" markets (Kenya, Nigeria, Egypt, South Africa) captured 72% of total funding; Kenya led outright with $1.04B (+72%); South Africa led on equity deal count for the first time since 2017 — a meaningful diversification signal within the continent.
- Sector mix (H1 2026): fintech $556M/41% (48 startups) and logistics/transport $472M/35% (heavily skewed by EV company Spiro's $327M round alone) together took 76% of capital — but by deal count rather than dollars, healthtech (29), logistics (27), and agri/food (26) are nearly as active as fintech (48), pointing to a broader base of activity than the capital concentration suggests.
- Climate-tech-adjacent startups (energy, agri, waste, EV/logistics combined) took a collective ~39% of H1 2026 African funding — a notably climate-forward tilt versus other emerging regions.
- Critical read: the headline recovery story ("funding is up 25%") is doing real work to obscure that fewer companies are getting funded, at larger median size, with debt increasingly substituting for equity. That is consistent with a market where investors have gotten more selective post-2022-winter — good news for the strongest operators, a genuine tightening for everyone else.
6.6 Israel
Israel's H1 2026 funding ($8.6B, +45% YoY) is a striking number given more than two years of ongoing conflict, and the underlying pattern — fewer, larger, more experienced-founder-backed rounds — mirrors the concentration trend seen everywhere else in this report.
- Funding rounds fell 35% even as total capital rose 45% — the sharpest divergence of any region in this dataset, indicating unusually strong consolidation around fewer companies.
- Serial founders' share of funded rounds grew from 34% (2025) to 39% (H1 2026) — capital is increasingly flowing to repeat operators rather than first-time founders, a plausible wartime risk-aversion effect.
- Cybersecurity was the standout sector, with investment more than doubling versus H1 2025 — consistent with Israel's traditional strength and the heightened global demand environment.
- Israel is explicitly repositioning as a "Defense-Tech Nation," with defense-tech-specific funding reported at $3B and rising — tying directly into the global defense-tech surge covered in Section 2.3.
- Labor market resilience: early- and mid-stage Israeli startups grew headcount ~2% even as multinational tech continued layoffs elsewhere — a genuine bright spot for the domestic ecosystem.
- M&A activity fell 16% in deal count (100 → 84) but average deal value rose ~10% (ex-outliers); total M&A volume ran ~$10.7B in H1 2026 — again, fewer, bigger.
- Critical read: Israel is proving unusually resilient at the aggregate level, but the underlying shift toward serial founders and fewer, larger rounds suggests investors are pricing in real operational risk and hedging by backing only the most proven teams — worth noting for anyone assuming Israeli deal flow is business-as-usual.
Section 7
Emerging Indicators
These are the signals that don't show up in a regional funding table but are shaping where and how capital moves — worth tracking as leading indicators over the next few quarters.
7.1 Corporate and strategic capital is becoming a structural, not incidental, part of the stack
- Strategic checks are now large enough to set valuation floors on their own: Nvidia's $30B into OpenAI, Amazon's $5B (with options to $20B) into Anthropic, and Microsoft's $13B+ into OpenAI are sized more like infrastructure joint ventures than venture investments.
- Corporate VC funds are pulling the same liquidity lever as traditional VCs: 22% of CVC funds used secondary markets for liquidity in the latest survey year, up from 15% the year before — a sign that even strategic capital is under distribution pressure, not just financial VC.
- Two-thirds of financial-style CVC programs now operate off their parent company's balance sheet (vs. one in five strategic-style programs) — a structural signal of corporates trying to professionalize and insulate their venture arms from headline-driven parent-company decisions.
7.2 Secondaries are becoming a primary liquidity channel, not a workaround
- Global secondary market volume: >$210B in 2025, up from $273B in 2019 to $601B in 2024 on a broader basis — a ~120% five-year expansion. US venture secondaries alone hit $106.3B in 2025.
- With only 202 global IPOs in 2025 and 26 in the first stretch of 2026, secondary SPVs (pooled vehicles that consolidate many small investors into one cap-table line) are increasingly competing with IPOs and M&A as the primary way employees and early investors get liquidity — companies are staying private longer through their highest-growth years, and the market has built parallel infrastructure to cope with that.
- Why this matters for founders: a deep secondary market reduces the pressure to IPO or sell early, but it also means "the company is doing well" and "insiders have gotten liquid" are no longer the same signal they used to be — worth factoring into how you read another company's apparent success.
7.3 Circular financing is now large enough to be a market-structure question, not a one-off
The AI capital stack in 2026 includes several large, well-documented circular arrangements: Microsoft's $13B+ into OpenAI alongside OpenAI's $250B Azure commitment; Oracle building $300B of Stargate data-center capacity for OpenAI; Amazon's $5–20B into Anthropic alongside Anthropic's $100B, decade-long AWS commitment; Nvidia's $30B into OpenAI's $122B round, with OpenAI remaining one of Nvidia's largest GPU customers. None of this is illegal or even unusual in kind — vendor financing has always existed — but the scale means a meaningful share of "committed AI demand" currently reflects capital that started inside this same small circle of companies rather than organic end-customer spending. Asset managers frame it as a virtuous circle that lines up suppliers, builders, and customers to meet real demand; the more skeptical read is that it front-loads demand that has to show up organically later to justify the valuations built on it now. This is covered as a business-model pattern in Section 4.3 and as a systemic risk in Section 8.1 — it belongs in both places.
7.4 Vendor-lock and platform dependency are becoming an explicit part of diligence
As agentic AI and services-as-software business models mature (Section 4), a new diligence question is emerging for anyone evaluating or building on top of a frontier-model API: how much of your roadmap and cost base is exposed to a single model provider's pricing and capability decisions. Multi-model architecture — building to swap providers rather than lock to one — is starting to show up explicitly as a stated engineering priority in enterprise AI RFPs, not just a theoretical best practice.
Section 8
Risk Analysis
This report has flagged risk throughout via "critical read" callouts. This section pulls the systemic ones together in one place, since they don't respect the regional or sector boundaries used elsewhere in the report.
8.1 Circular-financing / concentration risk
Covered in detail in Section 7.3. The specific failure mode: if end-customer AI monetization takes longer than current models assume, or if one participant in the Microsoft–OpenAI–Nvidia–Amazon–Anthropic–Oracle web hits financial trouble, the effect would not stay contained to that one company — it would flow through committed-spend obligations to every company whose "contracted demand" depends on that spending continuing. This is the closest thing in this report to a single point of failure for the entire 2026 funding boom.
8.2 The capex/revenue gap (bubble mechanics, not just bubble rhetoric)
Detailed in Section 3.2: a 4–13x gap between required and actual AI revenue, resting on assumptions (70%+ data-center utilization, 5–6 year GPU depreciation schedules, 24x token-volume growth by 2030) that are testable, not certain. The honest framing is not "is this a bubble" but "which of these specific assumptions breaks first, and how much of the current multiple structure (Section 3.1) survives that."
8.3 Physical infrastructure: power is now a harder constraint than capital
- Grid interconnection approvals in the most AI-relevant markets (Northern Virginia, Silicon Valley, Northern Europe) now take 24–36 months — longer, in practice, than it takes to raise and deploy the capital for a new data center.
- Gartner projects 40% of AI data centers will be power-constrained by 2027 — and this is described as a lagging indicator, since teams planning capacity today are already running into it.
- A 50,000-GPU cluster draws roughly 88MW continuously, requiring large-scale utility planning most single companies cannot secure alone; next-generation hyperscaler campuses (100–750+MW) compete directly with municipal power infrastructure.
- Implication: capital availability (Section 1) is no longer the binding constraint on AI infrastructure buildout in the way it was in 2023–24 — physical grid capacity now is, which changes where new capacity can realistically be sited and favors regions (parts of the Gulf, India) with newer grid buildout capacity and available land over already-saturated hubs.
8.4 Geopolitical and export-control risk
- A 25% US tariff on advanced AI chips (H200, MI325X) took effect January 2026; China export licenses shifted from presumptive denial to case-by-case review, capping shipments at roughly half of prior volumes; TSMC, Samsung, and SK Hynix lost blanket exemptions for China-based operations.
- The December 2025 "Pax Silica" framework formed a ~24-nation, US-led coalition (including India, Japan, and South Korea) explicitly designed to build a silicon supply chain outside China's orbit — a genuine tailwind for India's chip-assembly ambitions (Micron's $2.75B Gujarat facility; the Tata-PSMC Dholera fab targeting 28nm trial production by December 2026) but a hard signal that the semiconductor value chain is now organized around self-reliance blocs, not free trade.
- Implication: any startup or platform whose roadmap assumes uninterrupted, borderless access to frontier compute should treat that as a planning assumption to stress-test, not a given — the direction of travel in every major jurisdiction is toward more friction, not less.
8.5 Regulatory risk — Europe's AI Act as the leading case
- High-risk system obligations (covering employment, credit, education, and law-enforcement use cases) were pushed from August 2026 to December 2027 — a genuine reprieve, but startups in regulated verticals now face a hard deadline with defined, substantial penalties (up to €35M or 7% of global turnover for prohibited practices; up to €15M or 3% for high-risk violations).
- Real compliance costs are material even for mid-sized companies: €193K–330K for initial quality-management-system setup, €71K–150K in ongoing annual monitoring — and nearly a quarter of surveyed startups report spending over 30% of total budget on compliance.
- This has a measurable relocation effect: a 2026 CCIA Europe survey found 24% of founders had considered or completed a headquarters relocation over AI regulation broadly, with roughly 10% of EU scale-ups actually relocating — about 85% of those to the United States.
- Implication: regulatory clarity (Europe now has more of it than the US in absolute terms) is not the same as regulatory ease — and the relocation data suggests founders are currently pricing compliance burden higher than they're pricing the value of clarity. Worth watching whether India, the UAE, or other jurisdictions position themselves as a deliberately lighter-touch alternative for regulated-AI company formation.
8.6 Talent and key-person concentration
Israel's serial-founder share rising from 34% to 39% of funded rounds (Section 6.6) and the broader pattern of capital concentrating around a small number of proven teams across every region in this report point to the same underlying risk: an increasingly thin bench of founders and researchers that the market currently considers fundable at scale. That is good for the individuals in that bench and a structural fragility for the ecosystem around them — both the AI-lab talent war (compensation packages now a genuine capital-intensity signal in their own right) and the broader serial-founder concentration reduce the number of independent bets the system is actually placing, even as dollar totals suggest otherwise.
Section 9
Founder, Company & Capital-Origin Data
Everything so far in this report is funded-company data: who raised, how much, at what price. This section covers what happens before and beneath that layer — survival, burn, who actually gets funded, the pipeline feeding the funded layer, and where the capital itself originates. Where reliable public data doesn't exist at useful granularity, that's stated plainly rather than papered over.
9.1 Startup survival — the mortality curve behind the funding numbers
| Years since founding | Survival rate | Cumulative failure rate |
|---|---|---|
| Year 1 | 77.9% | 22.1% |
| Year 2 | 65.9% | 34.1% |
| Year 3 | 56.3% | 43.7% |
| Year 5 | 51.4% | 48.6% |
| Year 10 | 34.7% | 65.3% |
US Bureau of Labor Statistics cohort data through March 2025, all-industry. Tech-specific failure risk is front-loaded — the Information sector is 1.29x more likely to fail than the all-industry average in Year 1, narrowing to 1.07x by Year 10.
- Venture-backed specifics: 431 tracked VC-backed shutdowns since 2023 destroyed $17.5B in equity value, at a median of $11M raised and 22 months between last raise and shutdown.
- Running out of capital is cited in ~70% of shutdowns, but "poor product-market fit" is the deeper cause in 43% of cases — capital exhaustion is usually the proximate trigger, not the root cause.
- Series A shutdowns specifically rose from 6% to 14% of all closures in one year — a notable acceleration in later-but-not-late-stage failure that doesn't show up in any of the funding-volume tables elsewhere in this report.
- Data limitation: reliable, methodologically comparable survival data exists only for the US. The EU shows a birth rate of 10.5% vs. a death rate of 8.5% (2023) but isn't directly comparable to US cohort survival curves, and no equivalent dataset exists publicly for India, MENA, Africa, or Israel at this granularity — a genuine blind spot in every regional ecosystem report, not just this one.
9.2 Burn rate and runway — what "funded" actually buys
| Stage | Median runway | Median monthly burn |
|---|---|---|
| Pre-seed | 8.2 months | $15K–$50K |
| Seed | 10.8 months | $50K–$150K |
| Series A | 14.6 months | $200K–$600K |
| Series B | 19.4 months | $500K–$2M |
| Series C+ | 24.8 months | n/a — highly company-specific |
US data (Carta / Kruze Consulting, 2025) — the only market with sufficiently standardized cap-table reporting to produce this benchmark reliably.
- The gap between "funded" and "safe": the median funded startup runs 12–15 months of runway at any given time — below the 18–24 months most investors consider genuinely safe. Companies below 12 months face real distress risk (an 18% fundraising success rate once under 6 months remain); ~31% of pre-seed companies are already in that acute zone. Startups holding 18+ months of runway close their next round at 2.4x the rate of those below 12 — runway is a leading indicator of fundability, not just a defensive cushion.
- Data limitation: no equivalent burn/runway benchmark exists publicly for India, MENA, Africa, or Israel — this is entirely a US data point, extrapolated to other markets only at real risk of being wrong, since local cost structures (talent cost especially) differ substantially.
9.3 Founder funding gap — beyond MENA
- Globally (US data, the only market with a comparably rigorous dataset): female-founded companies raised a record $73.6B in 2025, over 25% of total US deal value for the first time — but the number of deals going to female-founded companies has fallen since the 2021 peak; all-male-founded teams still receive over 3x as many deals as mixed or all-female teams. Capital is up, deal access is down — the same barbell pattern as everywhere else in this report, applied to founder gender.
- The efficiency data is the more important number: female-founded startups run 15% lower burn rates, generated ~10% more cumulative revenue over five years, and returned 78 cents per dollar of funding versus 31 cents for all-male-founded companies — meaning the gap in capital access does not track a gap in demonstrated capital efficiency. Nearly three-quarters of US VC firms have no female investing partner, which is one structural explanation for a gap that isn't explained by performance.
- Data limitation: no comparably rigorous founder-gender dataset exists for India, MENA (beyond the single 95%/0.14% split already cited in Section 6.4), Africa, or Israel — this section is a US data point, not a global one, despite the pattern likely generalizing directionally.
9.4 The pre-VC pipeline — accelerators as a leading indicator
Y Combinator is the closest thing to a standardized, longitudinal dataset on the earliest-stage pipeline, and its 2026 shape mirrors the concentration story running through this entire report at the very first rung of the funding ladder.
- Batch sizes are shrinking from the 2022 peak (~399 companies) to 93–274 per batch in 2025–26 — YC itself is selecting for a narrower, more curated cohort even as "accelerator" activity broadly expands.
- Geographic concentration is intensifying, not dispersing: San Francisco's share of YC founders rose from 21% to 73% over five years — the sharpest reconcentration in YC's 20-year history, and a striking reversal of the pandemic-era decentralization trend.
- Founding team size has shrunk (3–5 people at launch today vs. 11–14 during 2010–2022) and remote/hybrid arrangements have collapsed from 83% (2021) to 14% (2025) — smaller, more concentrated, more in-person teams building AI-native products from day one (B2B + SaaS + AI tags dominate the current portfolio).
- Portfolio outcomes at this scale: 69% of all-time YC companies remain active, 12.9% have been acquired, 0.4% are public — a useful base rate against which to read the mega-round headlines elsewhere in this report.
- Read against the rest of the report: the same barbell dynamic — concentration into fewer, better-resourced bets — is visible from the very first funding rung (YC batch composition) all the way through to $100M+ mega-rounds (Section 1.1). This is not a late-stage phenomenon layered on top of a healthy base; the base itself is narrowing.
9.5 M&A and acquihires — the exit corridor outside the IPO window
- Global M&A with disclosed value: ~2,300 deals worth $214B in 2025 (+91% YoY), with deal count roughly flat — the same larger-checks-fewer-deals pattern as primary funding. The US alone represented 73% of deal value and 56% of deal count globally.
- The largest venture-backed acquisition in history closed in this window: Google's $32B purchase of Wiz. Other notable 2025–26 deals: OpenAI's $6.5B acquisition of Io; SoftBank's $6.2B purchase of Ampere Computing.
- KPMG's read for 2026: acquisition pricing is increasingly "dictated by the strategic value of a company's talent and its intellectual property" rather than revenue multiples — consistent with the accelerated acquihire trend specifically at seed/Series A, where an acquirer is often buying a team, not a business.
- Implication: with the IPO window still narrow and selective (Section 1.2), strategic M&A — increasingly priced on talent and IP rather than revenue — is the more realistic exit path for the large majority of venture-backed companies in every region covered in this report, not just the handful chasing a public listing.
9.6 Where the capital actually comes from — cross-border origins
Regional funding tables (Section 1) show where capital lands, not where it originates. The clearest, most current case study is Gulf sovereign wealth capital into India — directly relevant to any cross-border market-access thesis.
- Gulf sovereign funds deployed $1.7B into India in H1 2026 — more than double 2025's $700M, but still only 3.1% of the $53.9B in total Gulf sovereign capital deployed globally in the period, down from a 5.2–6.3% India share in 2022–2024.
- The pledge-versus-deployment gap is the real story: Saudi Arabia's long-standing $100B general pledge and Qatar's $10B ambition remain almost entirely undeployed; ADIA's much-discussed $1B India commitment (May 2026) is still an "exploration agreement," not a transaction. Global SWF research attributes the gap to India lacking a single AI-scale megadeal comparable to what's pulling Gulf capital into the US, plus governance, approval predictability, and exit-path concerns that Gulf allocators weight heavily. Pledges function as durable "political envelopes" that stay open for years without converting — worth knowing before treating any announced Gulf-India pledge as committed capital.
- Gulf sovereign vehicles are themselves increasingly investing in venture as a strategic asset class, not a speculative sideline — Saudi Arabia's PIF routes capital through Jada Fund of Funds into firms like Founders Fund and a16z; Mubadala and Sanabil have gone direct into regional fintech (Tabby, Tamara); Qatar's QSTP funds seed-stage regional startups directly.
- Africa's diaspora — an estimated 350 million people the African Union now formally refers to as the continent's "Sixth Region" — is a large but structurally under-quantified capital source: publicly available data confirms the mechanisms (diaspora savings products in Egypt, investment-oriented programs in Ghana) and the directional shift from consumption remittances toward productive investment, but no reliable aggregate figure exists for diaspora capital specifically flowing into African startups (as distinct from remittances broadly) as of this report.
- Data limitation: granular, sourced-by-LP-origin data (how much of a country's VC funding is domestic vs. foreign, and from where) does not exist publicly at this level of detail for any region covered in this report except the Gulf-into-India case above, which was only reconstructable because Global SWF specifically tracks sovereign wealth allocations. The same question for the US, Europe, Africa, or Israel — what share of domestic VC funding is foreign-sourced, and from which countries — cannot currently be answered from public sources with confidence.
9.7 What still can't be reliably sourced
In the interest of not manufacturing false precision: customer acquisition cost and lifetime-value benchmarks by sector, gross-margin trends specific to AI-native companies (COGS inflation from inference costs versus traditional SaaS hosting costs), aggregate non-dilutive/revenue-based-financing volume (the vendors and instruments are well documented; a reliable market-size figure is not), and university/research spinout or patent-commercialization rates by country all remain outside what public sources support at report-grade confidence as of September 2026. Where a number would be useful but isn't defensible, this report omits it rather than approximates it.
Section 10
Region × Sector Matrix
A consolidated view of Sections 5 and 6, for anyone trying to answer "where is sector X strongest" without cross-referencing two separate parts of the report. Blank cells are not zero activity — they mean the trackers used for this report publish that sector globally without a regional split, or that region without a sector split, but not both together. That inconsistency is itself a real limitation of how startup data is currently reported, not a gap specific to this document.
| Sector | India | USA | EU | MENA | Africa |
|---|---|---|---|---|---|
| Fintech | ~25% of deals | not separately broken out | not separately broken out | $708M / 51 rounds (41% of region) | $556M / 41% (H1'26) |
| Legal Tech | — | 75% global share (2025) | 64.3% of YTD'26 global capital | — | — |
| PropTech | strategic relevance noted | ConTech $4.8B (global figure) | — | $241M / 18 deals | — |
| HealthTech/Biotech | ~10% of deals | $7.4B digital health + $9.1B+ biotech | — | — | 29 startups funded (H1'26) |
| Defense Tech | — | $14.6B YTD'26 (global leader) | Fastest-growing after AI (Munich hub) | — | — |
| AI / Deep Tech (broad) | ~15% of deals (fastest-growing) | 86% of all VC $ (H1'26) | >50% of funding (Q1'26) | not cleanly separated from fintech/logistics | not cleanly separated |
| Physical AI / Robotics | — | Majority of $7.38B YTD'26 global total | Notable presence (e.g., NEURA Robotics, Germany) | — | — |
Compiled from figures cited in Sections 5 and 6 of this report; see those sections for full sourcing.
Section 11
Real-Economy & Industrial Sector Trends
Everything so far uses the standard tech-media sector list — fintech, legal tech, proptech, defense tech, physical AI, climate tech, semiconductors, quantum, crypto. That list is what gets covered because it's what venture capital concentrates in, but it leaves out most of the formal economy: agriculture, industrial manufacturing, automotive, mining and metals, energy generation, insurance, telecom infrastructure, materials science, commerce, hospitality, and consumer-services categories all have genuine 2026 startup activity that a narrower "AI trends" lens misses entirely. This section covers those, using a standard industry-classification taxonomy (the one screener.in uses for Indian listed equities, ~191 named industries) as the checklist — and says plainly, in 11.20, which parts of that taxonomy have essentially no venture activity behind them. Section 16 (Appendix) goes further and maps every single one of those ~191 named industries individually against this report, so the taxonomy's coverage is fully auditable rather than asserted.
11.1 Agriculture & AgriTech
- Global funding is soft and concentrated: $853M in full-year 2025 (down 16% from 2024's $1.02B); 2026 YTD ($434M through July) looks like recovery only because a single round — Halter's $220M raise (virtual fencing / livestock monitoring) — accounts for more than half the total.
- Median round size has been falling for three straight years: $16.8M (2024) → $10M (2025) → $7M (2026 YTD) — the opposite of the mega-round concentration seen in AI, and a sign that agritech investors are staying cautious on check size even as they keep writing checks.
- Animal-health technology (livestock monitoring, virtual fencing, feed optimization) is the standout subsector — 67.5% of YTD 2026 capital from just 14.8% of deals — while farm-automation systems, last year's leading category, contracted sharply (from 39.7% of capital in 2025 to 8.3% in 2026).
- Notable shift: Europe now accounts for 63% of agritech deal formation (up from 39% in 2025), while North America keeps capital dominance (59.3% of dollars on just 25.9% of deals) — the same US-capital-concentration pattern seen throughout this report, replicated in a sector most people don't associate with it.
11.2 Industrial Robotics & Manufacturing Automation
- Robotics overall: $18.8B raised globally through mid-2026, already ~25% ahead of all of 2025 ($15B) and well past the 2021 peak ($14.1B) — but this headline number is dominated by the humanoid and defense-adjacent names already covered in Section 2.2 (Neura Robotics, Skild AI, Saronic), not by traditional industrial-arm or logistics-robot manufacturers.
- The industrial reality check: humanoid installations are projected to jump from ~2,000 units (2024) to ~60,000 (2026) — real growth, but from a tiny base, and industry practitioners are openly skeptical of the hype gap. Teradyne Robotics' CCO put it plainly: the question isn't whether humanoids generate buzz, it's whether they "are actually trying to solve" the manufacturing problems that autonomous mobile robots and conventional industrial arms already handle more cheaply. GM's own assessment — "80% success is failure in production" — is a useful corrective to reading robotics funding totals as a proxy for production-floor deployment.
- US reshoring and manufacturing-plant expansion is the more durable demand driver across all robot types, not just humanoids — this is the category to watch for India's own manufacturing-investment thesis, where automation adoption is a policy priority independent of the humanoid narrative.
11.3 Automotive, EV & Autonomous Vehicles
- EV-specific funding remains well below its 2021 peak: ~$3.6B across ~50 rounds in 2026 YTD vs. nearly $19B in 2021 — described by trackers as "neither especially weak nor particularly robust," which is a fair read of a sector that has normalized after the SPAC-era excess.
- Autonomous vehicle funding has meaningfully outpaced traditional EV funding this year — Wayve alone raised $1.2B at an $8.6B valuation — suggesting investor enthusiasm has rotated from "electric" to "autonomous" as the more fundable thesis within mobility.
- Notable rounds beyond Wayve: Slate Auto (electric pickups, $650M Series C), DeepWay (autonomous electric trucks, $310M), Also (Rivian micromobility spin-out, $200M) — a mix that spans passenger, freight, and micromobility rather than concentrating in one vehicle class.
11.4 Mining, Metals & Critical Minerals
Directly relevant given the bullion and precious-metals domain knowledge in your own background — this is a smaller, quieter category than the others in this report but a strategically important one.
- Roughly $2B in tracked funding across ~229 mining-technology startups globally (average $78.5M per company, though this is skewed by a handful of large physical-AI-adjacent robotics rounds tagged to the sector), spanning AI-driven exploration, autonomous extraction equipment, electrification of mining fleets, lithium extraction, and supply-chain transparency for critical minerals.
- The strategic context matters more than the funding total: critical-minerals startups sit directly inside the "Pax Silica" self-reliance-bloc dynamic covered in Section 8.4 — government funding (US DOE critical-minerals grants, similar EU and Indian programs) is a larger and faster-growing capital source for this category than traditional venture right now, which makes it a policy-driven sector more than a VC-driven one at this stage.
- Gold and bullion-specific technology (trading infrastructure, provenance/traceability, tokenized bullion) doesn't appear as its own tracked venture category in any dataset used for this report — it shows up, if at all, inside the broader real-world-asset tokenization figures cited in Section 2.6 ($36B+ in 2025) rather than as a distinct, sized market. That's a genuine data gap, not an indication of low activity.
11.5 Energy: Grid, Storage & Nuclear
Climate tech overall was covered in Section 2.5 ($41.3B, H1 2026). Nuclear specifically is growing fast enough within that total to merit its own line.
- Nuclear-specific venture funding: >$4.5B across 81 companies through mid-2026, on pace to approach or exceed 2025's record ($6.2B across 93 companies) — driven overwhelmingly by AI data-center power demand (Section 8.3) rather than traditional utility-scale climate motivations.
- Antares (microreactors) raised a $370M Series C plus $100M in debt — a capital structure (equity + project debt) that mirrors the debt-substitution pattern seen in climate tech and Africa (Sections 2.5, 6.5) and is likely to become the default financing shape for capital-intensive energy infrastructure generally.
- A regulatory-arbitrage dynamic is emerging: the US NRC took roughly six years to approve NuScale's small-reactor design; the current administration is targeting an 18-month approval timeline. Investors are explicitly betting on regulatory speed as a competitive moat — whichever jurisdiction moves fastest on approvals captures outsized advantage, which is the same dynamic playing out in AI regulation (Section 8.5) but running in the opposite direction (a race to approve faster, not a race to regulate more).
11.6 InsurTech & Capital Markets Infrastructure
- InsurTech funding surged 4.2x YoY to ~$1.54B YTD 2026 (vs. $364M in the same 2025 period) — but, consistent with every other sector in this report, the rebound is narrow: Alan and Corgi alone account for roughly 60% of YTD capital, and average round size jumped from ~$20M to $57M.
- Where AI is actually working in this sector: the funding data explicitly rewards AI applied to insurance-specific workflows (underwriting automation: $8M → $178M YoY; core systems: $10M → $185M YoY) over generic horizontal AI tools repositioned for insurance — the same "vertical AI beats general-purpose AI" pattern flagged as Synthesis point 5, now visible inside a single sector's internal capital allocation.
- Capital-markets infrastructure (trading platforms, alt-data, post-trade tech) doesn't have a comparably clean 2026 aggregate figure in the sources used for this report — funding here tends to get folded into "fintech" broadly (Section 5.1) rather than tracked as its own category, which is itself worth noting as a data-organization gap.
11.7 Satellite, Telecom & Connectivity
- Communications-satellite startups: ~$4B raised cumulatively across the sector's top-ranked companies, most still at seed-to-Series-B stage — a young category (the large majority of companies were founded post-2015) still being built out rather than consolidating.
- Direct-to-device satellite connectivity (bypassing traditional cell towers) is the specific sub-thesis attracting fresh 2026 capital — Spain's Sateliot is raising to accelerate a 5G satellite network aimed at phone connectivity, competing indirectly with Starlink's own direct-to-cell ambitions.
- Data limitation: traditional telecom equipment and terrestrial telecom-services startup funding (as distinct from satellite) does not have a clean aggregate 2026 figure in the sources used here — this is a mature, capital-intensive, mostly-incumbent-dominated category (Ericsson, Nokia, Huawei, and national telcos) where venture-stage activity is genuinely limited outside of satellite and specific 5G/6G-adjacent niches.
11.8 Materials Science & Specialty Chemicals
A smaller-check, longer-timeline category than most of this report, but a genuine and growing one — bio-based alternatives to petrochemical inputs, AI-accelerated materials discovery, and performance-matched sustainable chemistry are all attracting funding across the US, UK, Germany, and Belgium (Oceanium, BIOWEG, Coreshell, CuspAI, AmphiStar are among the more recently funded names, typically at $10–100M Series A scale). No clean global aggregate figure exists in the sources used for this report — this remains a company-by-company category rather than one with reliable market-sizing data, which is itself consistent with its early, pre-consolidation stage.
11.9 Consumer, D2C & Retail
The clearest counter-narrative in this entire report: not every consumer-facing category is booming. India's D2C sector — the best-documented case in the sources used here — has fallen every year since 2022: $1.6B (2022) → $930M (2023) → $757M (2024), an 18% YoY decline accelerating to a 54% cumulative drop over two years, driven by rising customer-acquisition costs, brand oversaturation, and pressure to show profitability rather than growth-at-any-cost. Zero unicorn exits and only 3 IPOs in 2024. This is worth holding up against the AI-driven headline numbers elsewhere in this report as a reminder that "startup funding" is not one uniform market moving in one direction — traditional consumer/D2C is in a genuine, multi-year contraction at the same time frontier AI is setting records.
11.10 Cybersecurity
The one category on this list that actually belongs on the standard tech-media list and simply got missed earlier in this report — it's a large, mature, and currently steady category rather than an emerging one.
- $10.6B raised globally in H1 2026, holding at historically elevated levels — though Q2 alone ($4.4B) was down ~30% from both the prior quarter and the year-ago quarter, suggesting the elevated H1 total leans on Q1 strength rather than sustained quarter-over-quarter acceleration.
- Eight rounds exceeded $100M in Q2 alone: Cyera (AI-enabled enterprise security, $600M at a $12B valuation), NinjaOne ($400M+ Series C extension, $12.3B valuation), Dream (AI/cyber defense for infrastructure, $260M at $3B) — AI-native security tooling is where the largest checks are concentrating, consistent with the vertical-AI pattern running through this entire report.
- M&A is active even without IPO volume: Motorola Solutions' $1.5B acquisition of D-Fend Solutions (counter-drone tech) was the standout Q2 deal — cybersecurity is one of the few categories in this report where strategic acquirers are paying full, disclosed prices rather than talent-and-IP acquihire pricing (Section 9.5).
- Read against the rest of the report: cybersecurity isn't capturing the frontier-AI-scale attention that OpenAI and Anthropic do, but it's one of the steadiest, least concentrated categories here — a reminder that "boring but essential" infrastructure can be a genuinely durable venture category even in a market this dominated by a handful of AI mega-names.
11.11 Space Tech
- $20.3B in private venture and growth-stage capital in 2026 — a record annual total for the sector, and this figure excludes SpaceX's own $75B IPO entirely.
- Geographic concentration mirrors the rest of this report: the US take 63% ($12.7B), China 20%, Europe just 10% — space is overwhelmingly a two-country race at the venture-funding level, regardless of where launch and manufacturing activity happens.
- Notable rounds: K2 Space's $500M Series D ($6.8B post-money, led by Kleiner Perkins and ICONIQ); Anduril's $5B Series H includes a space and satellite division nested inside its broader defense portfolio (Section 2.3) — space and defense tech are becoming increasingly hard to separate as distinct categories.
- The emerging sub-thesis: orbital compute. At least eight companies are now developing orbital data-center hardware, and SpaceX has filed FCC applications seeking authority to operate up to one million satellite-based data centers in low Earth orbit. This is a direct extension of the power-constraint problem covered in Section 8.3 — if terrestrial grid capacity can't keep up with AI data-center demand, orbital compute is the most aggressive bet currently being funded on solving that constraint by leaving the grid entirely.
11.12 EdTech
- Global funding: $1.0B in H1 2026, down 26% from $1.35B in the same period of 2025 — deal volume held roughly stable, meaning average round sizes shrank rather than investor count declining.
- A genuine regional divergence: East Asia deal volume grew 37% YoY and MENA "bucked the broader downward trend," while the historically dominant US and Europe markets contracted. K-12-specific startup funding has "cratered" post-pandemic-boom according to trade coverage, while workforce training and development (Preply's $150M raise, Multiverse's $70M) held up as the strongest subsector — enterprise/adult reskilling is proving more durable than consumer or school-focused edtech.
- Early-childhood education more than tripled its 2025 deal count — a concentrated pocket of investor appetite inside an otherwise contracting category, and a useful example of how a sector-level decline number can still hide a genuinely hot sub-niche.
11.13 Longevity & Biotech Beyond Digital Health
Distinct from the digital-health and clinical-AI data already covered in Section 5.4 — this is biotech aimed at extending healthy lifespan rather than treating discrete conditions, and it shows the sharpest capital concentration of any sector in this entire report.
- Four companies — Altos Labs, Retro Biosciences, NewLimit, and Life Biosciences — have absorbed roughly 60% of all disclosed longevity-sector funding tracked between 2022 and 2025 (~$4.7B of it). Altos Labs alone has raised $5.56B cumulatively. This is a more extreme concentration ratio than OpenAI+Anthropic's 43% share of global startup funding (Section 1.1) — in a smaller category, but proportionally even more top-heavy.
- Big pharma is beginning to take direct equity positions rather than only licensing deals: Eli Lilly's $45M investment in NewLimit (October 2025) was described as one of the first direct equity positions by a top-five pharma company in a cellular-reprogramming asset; Novartis has a milestone-based partnership with BioAge worth up to $550M.
- A real clinical milestone landed in this window: Life Biosciences received FDA IND clearance (January 2026) for the first cellular-rejuvenation therapy using epigenetic reprogramming to enter human trials — moving the category from purely speculative to has-a-regulatory-foothold.
- The market-sizing claim to treat skeptically: UBS projects an "$8 trillion economy" built around extending healthy human life by 2030. Given this report's repeated caution about capex-vs-revenue gaps (Section 3.2) and pledge-vs-deployment gaps (Section 9.6), a projection that large, this far out, from a category currently generating a handful of billions in venture funding and one early clinical clearance, belongs in the same skeptical bucket as the AI capex assumptions — a plausible long-run thesis, not a number to underwrite near-term decisions against.
11.14 E-Commerce, Quick-Commerce & Social Commerce
Distinct from the D2C brand-funding contraction already covered in Section 11.9 — this is the commerce infrastructure and platform layer itself, which tells a genuinely two-speed story.
- The headline number is a collapse, not a slowdown: global e-commerce startup VC fell to roughly $7.3B in 2025 from a 2021 peak near $94B — a ~92% decline (PitchBook data via Yahoo Finance). But the composition shifted rather than vanished: "the destination side is down, enabling technology is up," per VMG Partners' Indy Guha — capital rotated from consumer-facing storefronts toward the infrastructure and AI tooling underneath them.
- Two sub-categories are bucking the downturn entirely. India quick-commerce: Zepto raised $450M at a $7B valuation (Oct 2025) and confidentially filed for a ~$1.2B IPO (reported Dec 2025) — with commentators explicitly flagging possible sector-bubble dynamics even as the rounds keep landing. Global live/social commerce: Whatnot raised a $225M Series F (Oct 2025) then a $545M Series G at a $20B valuation (Aug 2026) — called the largest raise in live-shopping history.
- The correction is real elsewhere: Getir exited the US, UK, and continental Europe entirely in 2024 (6,000+ jobs cut) to refocus on Turkey — still referenced as the sector's cautionary case in 2025-26 coverage. Africa's MaxAB-Wasoko wound down e-commerce operations in Morocco (July 2025) to pivot toward fintech, even as it acquired Egypt's Fatura the same year — consolidation and retreat, not growth, is the African pattern here, in contrast to Section 11.1's more resilient agritech story.
- MENA is the emerging third growth pole: Saudi Arabia's Ninja is raising a pre-IPO round targeting a $1B+ valuation (led by Riyad Capital, IPO targeted 2027), and Talabat acquired InstaShop outright from Delivery Hero for $32M (Feb 2025), pushing its grocery/retail GMV past $2.5B.
- Government support: India's ONDC (Open Network for Digital Commerce, a DPIIT initiative) is the most specific and substantial policy lever in this category — open digital-commerce infrastructure spanning retail, logistics, mobility, and financial services, targeted at 30-40M monthly transactions by its own CEO's estimate; actual 2025-26 achieved volumes were not independently confirmed in the sources used here.
- Data gaps, stated plainly: no meaningful 2025-26 quick-commerce or social-commerce funding data surfaced for the EU or Israel beyond Getir's European retreat, and no citable patent-filing dataset exists for dark-store logistics, hyperlocal delivery routing, or AI demand-forecasting specific to this category — only vendor and market-report commentary, not patent-office data.
11.15 Food Delivery, Cloud Kitchens & Restaurant Tech
- Concentration inside concentration: global foodtech VC hit $2.8B in Q3 2025 alone, but the top 20 deals took 78% of that capital, and a single round — Wonder Group's $1.1B Series E — accounted for 40% of the entire quarter (PitchBook). Restaurant tech (ghost kitchens, autonomous delivery, ordering systems) is now the dominant subsector at 56.7% of Q3 2025 capital, while early-stage median valuations fell 52.4% YoY to just $7.5M even as deal sizes rose — sharper founder dilution than the headline totals suggest. IPO markets were "entirely closed" in Q3 2025, pushing late-stage firms toward secondaries and debt.
- Consolidation is the dominant 2025-26 corporate action: DoorDash completed its $3.9B acquisition of Deliveroo (closed Oct 2025), and separately launched a drone-delivery unit, "DoorDash Air" (FAA Part 135 certified, July 2026), alongside its "Dot" sidewalk robot now live in Phoenix-area suburbs and Fremont, CA. Sweetgreen sold its Spyce/Infinite Kitchen automation unit to Wonder for $186M (Nov 2025) — a sign that kitchen-robotics scale is proving hard to reach standalone.
- India remains the most active single market: Rebel Foods (cloud kitchens) raised $25M from the Qatar Investment Authority at a $1.4B valuation, with FY25 revenue up 13.9% to ₹1,617Cr and losses narrowing 11.5%, targeting an IPO in 2025-26. Swiggy's Q1 FY26 revenue grew 45% YoY (₹6,383Cr), with Instamart GOV up 40% and food-delivery EBITDA reaching ₹1,000Cr. Talabat (MENA) posted Q2 2026 GMV of $2.9B (+11%) and revenue of $1.1B (+16%), raising full-year guidance.
- Kitchen robotics is struggling for real scale despite the funding headlines: Miso Robotics had only 14 Flippy units deployed at end-2025 (down from 17) on ~$385K net revenue in 2024. Jumia discontinued food delivery across seven African markets to refocus on physical goods — a clear regional retreat, echoing MaxAB-Wasoko's pivot in Section 11.14.
- Government support is now the single biggest swing factor in this sector's unit economics: India's four Labour Codes took effect Nov 21, 2025, requiring Zomato, Swiggy, Blinkit, Zepto, Ola, and Uber to contribute 1-2% of annual turnover to a gig-worker social security fund (implementation rules still pending state-by-state). The EU Platform Work Directive (2024/2831) must be transposed by member states by Dec 2, 2026, creating a rebuttable legal-employment presumption directly affecting Deliveroo/Wolt/Glovo economics — Spain's Riders' Law is already in force as a precedent. In the US, a March 2025 California Supreme Court ruling favored gig-employer classification even as a separate new California law permits unionization of certain gig contractors.
- Data gaps: no confirmed direct 2025-26-vs-2021-peak dollar comparison exists in the sources used here (the 2020-21 era included DoorDash's and Zomato's IPOs and Deliveroo's London listing, none of which have a clean modern-day equivalent yet), and no specific patent-filing counts were found for delivery robots or kitchen automation — activity is evidenced by deployments (DoorDash Air/Dot, Wing, Flytrex, Flippy) rather than by patent data.
11.16 Travel & Hospitality Tech
- A decade-low despite the AI narrative: global travel-tech VC funding fell below $5B in full-year 2025 (vs. a $16.3B peak in 2021 and $5.8B in 2024), with deal count collapsing from roughly 1,000/year a decade ago to ~200 rounds in 2025 — 83% of all cumulative funding now sits in just 6% of companies (Phocuswright). Q1 2026 continued the slide: ~$1B across 44 rounds, down from $1.2B/66 rounds in Q1 2025 — described in trade coverage as "decade-low deal activity." Hospitality tech specifically (property-management systems, AI guest experience) is the bright spot: $1B+ raised across 40 companies between April 2025 and March 2026, with PMS platforms alone capturing $408.1M.
- Agentic AI travel booking is a genuine, current sub-thesis: industry trackers described March 2026 as "the month agentic travel gets real" — AI agents handling end-to-end itinerary planning and booking rather than search-and-compare. Notable rounds: Mews (hotel PMS) raised a $300M Series D, the largest single deal in the window; Vuelo (AI-native travel booking, EU) raised a €64M seed round in March 2026; Guesty (vacation-rental management) raised $130M at a $900M valuation with 2025 IPO speculation that had not materialized as of the sources used here.
- OYO (India) is the sector's clearest bellwether: parent PRISM filed an updated DRHP targeting an $8B valuation and a ₹6,650 Cr fully fresh-issue IPO, with 75% of proceeds earmarked for debt repayment. Nine-month FY26 net profit reached ₹748 Cr (~3x full FY25), and overseas operations now account for 83%+ of revenue across 24,000+ hotels and 125,000 homes — though unresolved legal risk remains (a Zostel dispute, US trafficking lawsuits, a SoftBank tax dispute, Indian antitrust penalties).
- Government support, specifically: Saudi Arabia's Tourism Development Fund ran a "Tourism Growth Accelerator 2025" program — 17 startups at its Demo Day, 100+ graduated overall, 9,000+ entrepreneurs supported, and over SAR 30M secured by portfolio startups — and Saudi's Public Investment Fund approved a 2026-2030 strategy naming travel, tourism, and entertainment as core Vision 2030 pillars, consistent with the broader Gulf sovereign-capital pattern documented in Sections 6.4 and 9.6.
- Data gaps, stated plainly: no Israel- or Africa-specific travel-tech funding totals were found despite each country/region having an overall tech-funding figure elsewhere in this report; no verified 2026 IPO completion exists for either Guesty or OYO (both remain pre-IPO or filed-but-pending as of September 2026); and no hard patent-filing count data exists for AI itinerary planning or dynamic pricing — only directional trend commentary.
11.17 Gems, Jewellery, Watches & Lab-Grown Diamond Tech
Flagged as a data gap in Section 11.4's mining discussion — this subsection closes that gap. It's a genuine tale of two markets: upstream lab-grown-diamond production economics are being crushed by commoditization, while downstream jewellery-tech and D2C brands, plus institutional trade-infrastructure, are still attracting real capital.
- The commoditization story: lab-grown diamond wholesale prices have fallen more than 90% since 2018 (De Beers CEO Al Cook), and De Beers shut its own Lightbox lab-grown brand entirely in 2025 after $101.3M in losses in 2023 — a strong signal that the production/wholesale layer of this category is structurally unattractive to venture capital now, even as demand for the finished product keeps growing.
- India is the clearest active downstream market: nine pure-play Indian lab-grown-diamond startups collectively raised $26.4M in 2025, up from $4.7M across eight startups in 2024 (Third Eyesight) — small in absolute terms but a real acceleration. Named rounds: Aukera (₹90 Cr / ~$15M, led by Peak XV Partners, July 2026); Limelight (~$20M); GIVA (₹530 Cr internal round backed by Premji Invest, 2025); Jewelbox (in talks for ₹50 Cr); BlueStone filed/completed a ₹1,540.65 Cr IPO targeting a ~$1.4B valuation (2025-26, Accel-backed).
- The UAE is institutionalizing this as trade infrastructure, not just retail: Dubai's DMCC launched a dedicated Lab-Grown Diamond Vertical (Aug 30, 2026), explicitly separating LGD from natural-diamond trade to support industrial uses (semiconductors, quantum tech, medical, aerospace) alongside jewellery — UAE LGD trade hit 76.9M carats in 2025 (+91.5% YoY, $1.3B value) against total UAE diamond trade of $41.7B.
- Government support, specifically: India's Gem & Jewellery Export Promotion Council (GJEPC) reported $23.19B in sector exports for April 2025–January 2026, described as "stable" amid the new India-US trade agreement framework; India also introduced BIS Diamond Rules 2026 (IS 19469:2025) standardizing lab-grown-diamond disclosure and testing. In the US, the FTC's jewelry guides continue to govern "synthetic"/"lab-grown" disclosure terminology, with trade press reporting ongoing industry confusion over the exact lexicon.
- Data gaps, stated plainly: watches surfaced no startup/VC data at all in the research done for this report and would need a dedicated pass (the pre-owned/luxury-watch marketplace category — Chrono24, WatchBox-style platforms — is a plausible candidate); Israel's historic Ramat Gan/Tel Aviv diamond-exchange-technology angle produced nothing dated to 2025-26; Africa produced no 2025-26 venture data on the jewellery-tech side (the existing mining section covers African diamond extraction, not downstream jewellery); no patent-count data exists for CVD/HPHT growing-technology patents; and two conflicting global LGD market-size figures were found ($30B per DMCC vs. $61.8B per a lower-confidence market-report source) — both should be read as directional, not precise.
11.18 Packaging & Sustainable Materials
Adjacent to but distinct from the materials-science category in Section 11.8 — this is packaging specifically, and it is the thinnest, most regulation-driven category in this entire report.
- VC enthusiasm peaked in 2022 and has been cooling since: US sustainable-packaging investment totaled $1.91B cumulative from 2016 through May 2025, but 2022 alone was the high-water mark at $603.5M across 42 deals — combined 2023-through-May-2025 funding was less than that single 2022 year. Only 42% of companies funded between 2016 and 2022 raised a follow-on round, a real "innovation gap" signal (Supply Change Capital) — capital has skewed toward novel single-use-plastic-replacement materials and away from recyclability design, smart packaging, and recycled-content supply infrastructure.
- Named rounds: Notpla (UK, seaweed-based packaging) raised a £20M Series A (Oct 2024); Bambrew (India, plant-fiber/compostable packaging) raised INR 90 Cr (~$10.5M) Series B in July 2025 against a ~$9B (2024) Indian sustainable-packaging market projected to reach $57.2B by 2033; Coca-Cola committed to a $137.7M venture fund with Greycroft targeting sustainable-packaging innovation (2025, bottler-backed).
- Regulation, not funding volume, is the dominant 2025-26 story in this category: the EU's Packaging and Packaging Waste Regulation (2025/40) entered into force in February 2025 and applies EU-wide from August 12, 2026, with immediate PFAS restrictions on food-contact packaging and phased 2028-2030 labeling, reuse, and recycled-content mandates. Separately, a wave of 2025 packaging regulation swept MENA and Africa without accompanying venture-capital data: Egypt's fee-per-kg plastic-bag decree, Kenya's Sustainable Waste Management Act/EPR rules, Ethiopia's thin-bag ban, Nigeria's nationwide plastics ban, and Dubai's single-use-plastics phase 2 all took effect in 2025 — a clear demand driver for compostable and recyclable packaging startups in those markets, even though no funding rounds surfaced there in the sources used for this report.
- Data gaps, stated plainly: no verifiable single global 2025 or 2026-YTD total funding figure exists for this category — only the US cumulative and 2022-peak numbers above are solid; no MENA or Africa VC deal data was found at all, meaning that region's 2025 story is purely regulatory rather than venture-funded; Israel's Tipa (compostable flexible packaging, historically well-funded) shows no confirmed 2025-26 round; and specific patent-filing counts for mycelium- and seaweed-based packaging were not extracted from the trend reports that discuss them.
11.19 Pet Care & Veterinary Tech
- A cooling category after a 2021-22 boom: global pet-industry investment fell to $899.5M across 262 deals in 2025, down 14.2% in value and 13% in deal count from 2024 (GlobalPETS); a narrower Crunchbase reading of pet-and-veterinary-specific VC and strategic investment puts 2025 global capital at $660M+ — the gap between the two figures reflects differing category scope, not a contradiction. Veterinary practice-management software and tele-vet platforms are the most active subsectors, with China emerging as a hub for smart pet-monitoring devices and wearables.
- Named rounds: Digitail (vet practice SaaS) raised a $23M Series B (Nov 2025); Lupa (veterinary SaaS) raised $20M Series A (Oct 2025); Vetic (India, full-stack vet care, Gurgaon) raised $26M from Bessemer Venture Partners (2025); Drools (India pet food) took a Nestlé minority stake at a $1B valuation. By region, the US remains largest ($411.2M across 78 deals in 2025, its lowest total in six years) while Europe's value rose 43% YoY on fewer deals ($267.3M across 62 deals).
- Government support is thin, as expected for a young category: USDA/NIFA's Veterinary Services Grant Program awarded $3.8M in November 2025 (8 workforce-expansion grants at $250K each, 14 practice-establishment grants at $125K each) — targeted at the rural food-animal veterinarian shortage rather than pet-tech innovation specifically. The FDA maintains an Animal and Veterinary Innovation Agenda with Innovation Centers, but no 2025-26 dollar figures were found attached to it, and no India, EU, or MENA government pet-tech program was identified.
- Data gaps: no 2025-26 funding data was found for Trupanion, Fetch, or Lemonade Pet (the leading pet-insurance names), nor for PetDx beyond an earlier Series B, despite active searching — these may simply not have raised in the window, which is itself informative given the category's overall slowdown. No meaningful funding data was found for MENA or Africa, and Israel's pet-tech activity (an OurCrowd-backed "Pet Health Innovation Labs" cohort) dates to 2019 with nothing current identified. Patent activity is cited only in cumulative, undated terms (~7,000 US animal-health patents per PatentPC) — no 2025-26 filing or grant count exists in the sources used here.
11.20 Sectors with limited or no meaningful venture activity
In the same spirit as Section 9.7 — naming what isn't there rather than implying coverage that doesn't exist. Several categories on a standard industry taxonomy (cement and other construction materials, cigarettes and tobacco, paper/forest/jute products, printing and publication, diversified holding companies, and most "other utilities") are large, real parts of the economy but are structurally not venture-funded categories: they're dominated by mature public incumbents, have limited product-innovation cycles relative to capital intensity, or face regulatory/social headwinds that keep institutional venture capital away almost entirely. Textiles & apparel and household/personal products see real activity, but almost all of it is downstream in D2C brand-building (Section 11.9) or materials science (Section 11.8) rather than as their own tracked venture category. This also covers the large block of commodity, metals, mining-adjacent, and heavy-industrial categories on the full taxonomy — aluminium, copper, iron & steel and their downstream products, ferro-alloys, castings & forgings, rubber, ceramics, glass, granite & marble, explosives, dyes & pigments, industrial gases, and similar — which trade as public-market commodity businesses rather than venture-fundable ones; Section 16 lists each of these individually rather than leaving them implied. None of this means innovation isn't happening in these sectors — it means that innovation, where it exists, is financed through private equity, corporate R&D, or public markets rather than venture capital, and so falls outside what a startup-funding report can responsibly quantify.
Section 12
VC Fund Performance & the LP Side
Everything in this report so far is portfolio-company-side: who raised, at what valuation, in what sector. This section flips the lens to the investors themselves — the funds writing the checks, and the limited partners (pension funds, endowments, sovereign wealth funds, family offices) whose money those funds are deploying. It's arguably the most sobering section in the report, because it's the one place where the data doesn't support the "record year" framing at all.
12.1 The DPI crisis — cash actually returned to investors
TVPI (total value to paid-in — includes unrealized, on-paper value) is the number that gets quoted. DPI (distributions to paid-in — actual cash returned) is the number that matters to an LP deciding whether to re-up into the next fund, and it tells a much harder story.
| Fund vintage | Median DPI (cash actually returned) | Context |
|---|---|---|
| 2021 vintage (5 years old) | ~0.08x | $8 back for every $100 committed, five years in |
| 2018 vintage | ~0.15x | Fewer than 20% of funds this age exceed 1.0x DPI |
| 2017 vintage | ~0.31x | Fewer than 20% of funds this age exceed 1.0x DPI |
| 2016–2020 vintages (median, long-term) | ~0.7x | Historical VC average by year 8 — vs. 1.3x for private equity over the same horizon |
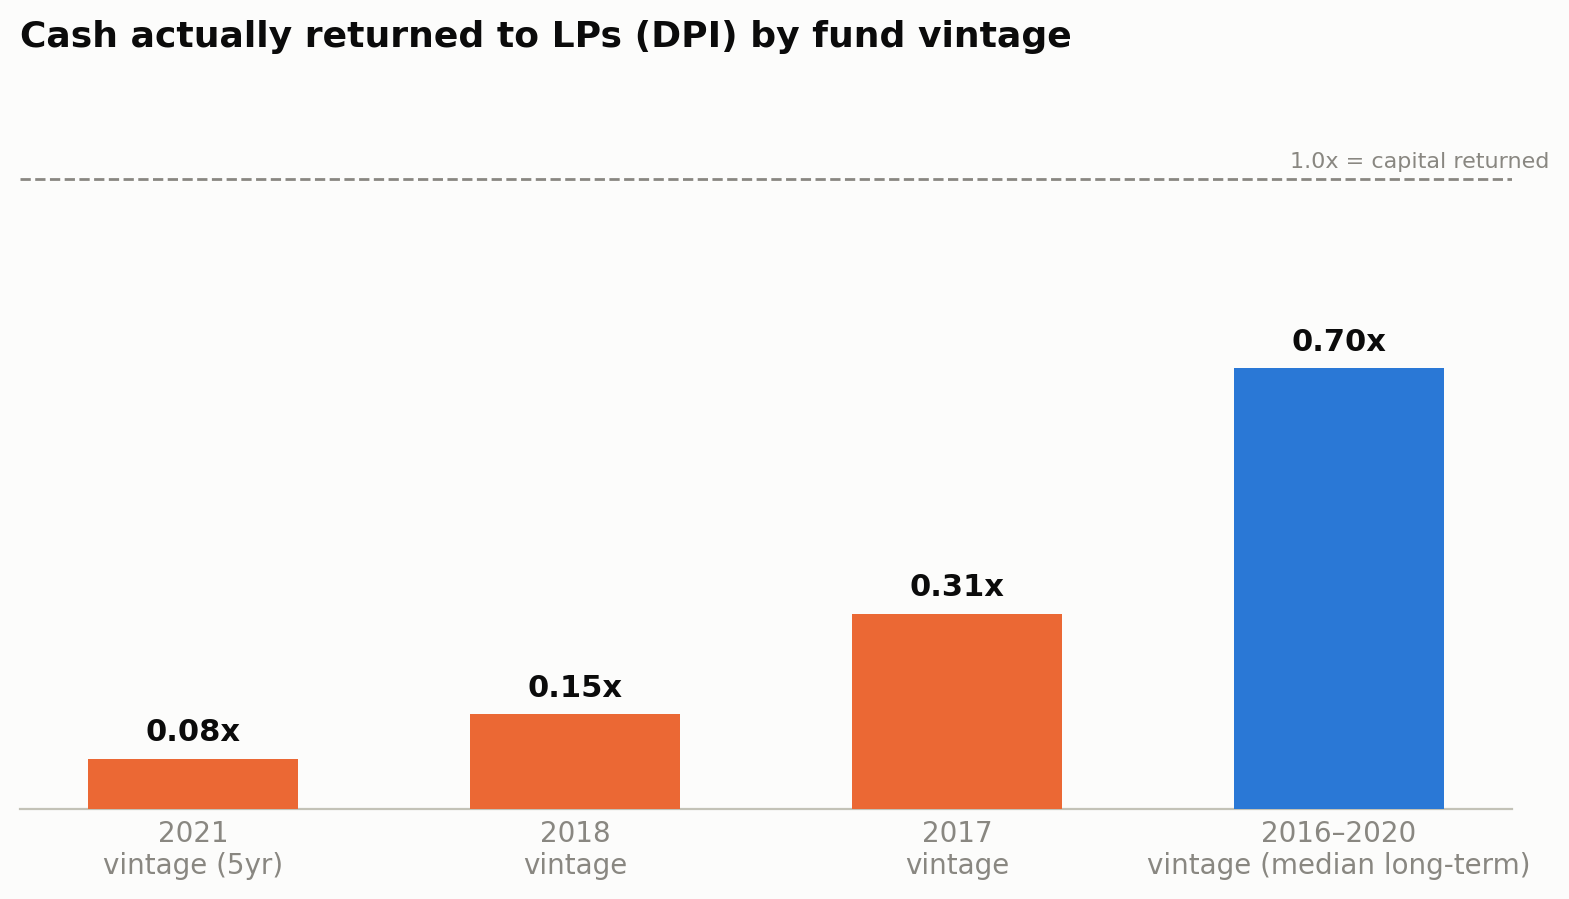
- Only 42% of 2020-vintage funds and ~25% of 2021-vintage funds had made any distributions at all to LPs by mid-2025 — meaning a large share of the capital raised at the top of the 2021 cycle has returned literally nothing yet, four-plus years later.
- Read against Section 1's "record year" framing: the 2026 funding boom is real at the deployment end (money going INTO companies), but the return end (money coming BACK to the people who funded the funds) is still working through a genuine multi-year drought from the 2021 vintage. Those are two different clocks, and most "venture capital is booming again" coverage — including the early sections of this report — is describing only the first one.
12.2 Performance dispersion — manager selection dominates outcomes
- Top-quartile 2016–2020 vintage funds: 2.6x–3.6x TVPI, 21–29% net IRR. Median funds of the same vintages: 1.5x–1.8x TVPI, 12–15% net IRR. The quartile spread exceeds 30 percentage points of IRR across most vintage years — wider dispersion than any other private-asset strategy, meaning which fund an LP picked mattered more than when they invested.
- Implication: in a market this concentrated at the company level (Section 1.1: two companies, 43% of global funding), fund-level returns are almost mechanically going to concentrate the same way — LPs in the handful of funds that got meaningful allocation into OpenAI, Anthropic, xAI, or Anduril are having a fundamentally different 2026 than LPs in funds that didn't. The "average" VC fund return number is close to meaningless this cycle.
12.3 Dry powder — the overhang and the pressure it creates
- VC-specific dry powder (committed but uncalled capital): ~$600.9B as of 2026 — down 19% from a 2023 peak of $743.9B, but still historically large.
- Vintage-year pressure is building: a meaningful share of this capital sits in 2022–2023 vintage funds whose investment periods (typically 3–5 years) are now running out, creating real pressure to deploy into a market where — per Section 3.3 — later-stage, non-AI companies are still working through down rounds and bridges. That combination (must deploy soon + best opportunities are narrowly AI-concentrated) is a plausible mechanical explanation for why AI's share of dollars keeps rising even independent of AI's own merits.
- Fund formation itself is under stress: VC fund close rates hit a 10-year low of just 39% in 2025 — the worst of any private-fund type — and average new fund sizes are shrinking. Fewer new funds are successfully closing even as existing dry powder needs to move, which is consistent with the down-round and bridge-financing data in Section 3.3: LPs are getting more selective about committing to new funds at exactly the moment many existing portfolio companies need more runway.
Section 13
Anomalies, Outliers & Emerging Patterns
The Cross-Regional Synthesis that follows identifies patterns repeated across the report. This section is a different lens: individual data points and divergences that stand apart from the general narrative, extreme values worth treating with extra skepticism, and early-stage signals not yet consolidated enough to count as established patterns.
13.1 Anomalies — data that contradicts the general narrative
- Quantum capital is moving opposite to quantum sentiment. Private funding fell to $1.2B in 2026 from a $4.1B peak in 2025 (Section 2.4) at the exact moment public quantum names (D-Wave, IonQ, Quantum Computing, Rigetti) trade at a combined ~$36B market cap with no collective profitability, and Quantinuum is filing for a Nasdaq listing above its last private valuation. Smart private money pulling back as public enthusiasm peaks is a classic pre-correction divergence, not background noise.
- Debt's role in emerging-market venture is not one trend — it's two, moving apart. Debt fell from 44% to 29% of MENA tech capital (Section 6.4) in the same period it rose to ~41% of African tech capital (Section 6.5). Same asset class, same broad "emerging market" bucket, opposite risk-appetite signal — a reminder that regional aggregation can hide two genuinely different investor behaviors.
- Capital access and demonstrated performance are moving in opposite directions for female founders. US female-founded companies receive roughly a third the deal count of all-male teams and deal count keeps falling from the 2021 peak, while returning 78 cents per dollar of funding (vs. 31 cents for all-male teams), running 15% lower burn, and pulling in a record $73.6B in aggregate (Section 9.3). This is not a pipeline story — it's a demonstrated-performance-vs-capital-access gap, which is the textbook definition of a market inefficiency rather than a rational allocation.
- Legal AI's geographic leadership flipped faster than category leadership normally does. From 75% North America (2025) to 64.3% Europe (2026, Section 5.2) in a single year — venture category leadership essentially never moves this fast organically. One round (Legora, $550M) did most of the work, which says more about how few data points sit behind a "regional trend" headline than about a structural European legal-tech advantage.
13.2 Outliers — extreme individual values worth flagging
- OpenAI and Anthropic together captured 43% of all global startup funding — every sector, every country, every stage — in H1 2026 (Section 1.1). Two companies, worldwide.
- SpaceX's single IPO ($85.7B) equals roughly a third of the entire US 2026 IPO market ($251B) by itself (Section 1.2) — a useful reminder that "the IPO window reopened" is currently a statement about one company more than about market depth.
- Saudi Arabia's -81% YoY H1 2026 funding swing (Section 6.4) is the single largest move of any regional figure in this report — a country's entire year-over-year "trend" can be nothing more than one missing mega-deal against an unusually strong prior-year comparison.
- Anthropic's revenue run-rate — $10B to $47B in roughly six months — deserves active skepticism, not just admiration. Given how much of the current AI capital stack runs through the circular Microsoft/Amazon/Nvidia compute-credit structure detailed in Section 8.1, a meaningful share of that "revenue" may reflect committed spend inside a closed loop of investors and customers rather than organic, arm's-length end-customer demand. The number is real; what it represents is less clear than the growth-rate headline suggests.
- ADIA's widely cited "$1B India commitment" (Section 9.6) is, on inspection, an unsigned exploration agreement, not a transaction — an outlier example of how thin some heavily reported "commitment" figures are once traced back to source documentation.
13.3 Emerging patterns — early signals, not yet fully formed
- Regulatory speed is becoming an explicit, investable thesis rather than a compliance line item. Nuclear approval-timeline compression (a targeted 18 months vs. a historical 6 years, Section 11.5) and the EU AI Act's measurable relocation effect (24% of founders considering leaving, ~85% of those to the US, Section 8.5) both show capital now pricing "which jurisdiction approves fastest" as a genuine competitive moat. Watch for this logic spreading to any other capital-intensive, regulated category — biotech, chip fabs, deep tech generally — including as a potential positioning angle for jurisdictions trying to attract that capital.
- Vendor-financed, circular-demand structures are generalizing beyond AI labs. The equity-in/committed-spend-out pattern that defines the Microsoft-OpenAI-Nvidia-Amazon-Anthropic web (Section 7.3) is starting to appear in nuclear and energy infrastructure financing too (Section 11.5's equity-plus-project-debt structures paired with data-center offtake commitments). This may be becoming the default financing shape for any sufficiently capital-intensive infrastructure category over the next few years, not an AI-specific quirk.
- The "vertical AI beats horizontal AI" discipline is intensifying from a category-level heuristic into a within-category one. It started as legal tech and physical AI outperforming generic SaaS and humanoid hype at the sector level (Synthesis point 5). It now shows up inside a single sector's internal capital allocation — insurtech underwriting-specific AI tools funded at roughly 20x the rate of generic AI-for-insurance repositioning (Section 11.6). Investors appear to be applying the same screening logic at increasingly fine grain, which suggests the discipline is maturing rather than staying a one-time market correction.
- A "lean-launch, fat-scale" asymmetry is emerging in how companies are actually built. YC founding teams have shrunk from 11–14 people at launch (2010–2022) to 3–5 today, while growth-stage headcount still balloons to a median of ~50 and a mean of ~199 (Section 9.4). AI tooling is visibly compressing the earliest team-building stage without yet compressing the scale-up stage — an early, testable signal of where AI is genuinely changing company-building unit economics versus where the hype has run ahead of the evidence.
- Flight-to-quality intensifies specifically under geopolitical and macro stress, not just as a general 2026 phenomenon. Israel's serial-founder share rose fastest of any region measured in this report (34% to 39%, Section 6.6) under its most acute period of stress — ongoing conflict alongside a 35% drop in deal count. That's a testable hypothesis for any other geopolitically stressed market: expect capital concentration around proven teams to accelerate, not just persist, whenever macro stress rises.
- GenAI is simultaneously devaluing old companies and reducing new companies' need to raise — two faces of one mechanism, not two unrelated coincidences. Section 3.4 documents the devaluation side: 220+ of 857 US unicorns now below $1B, 2021-vintage down 68% on average, because the market stopped paying for pre-AI, headcount-heavy cost structures. The mirror image shows up at formation: US seed deal count fell 39% (2,438 in 2022 to 1,494 in 2025) while total seed dollars deployed held roughly flat near $8.1B/year — fewer, bigger checks — and average seed team size fell 40% (10.3 to 6.2 people). "State of Seed Winter 2025" states the mechanism directly: "founders are betting they can accomplish more with smaller teams by leveraging AI tools." AI-native startups now capture 41.7% of all seed funding, and solo founders are 35% of new startups but only 17% of VC-funded ones — a real share are simply not raising at all. A Harvard/INSEAD study of ~50,000 YC/PitchBook startups adds the key nuance, and it cuts against reading this as simply "AI startups raise less": AI-native firms are 25% smaller in headcount but deploy ~20% more capital per employee — Revelio Labs frames its own finding as startups "hiring less and raising more," not raising less overall. Read together, the same underlying shift — GenAI collapsing the headcount needed to build and operate a company — is repricing yesterday's companies downward (3.4) and letting today's companies reach the same milestones with fewer people and, per person, more capital rather than necessarily less of it (13.3). One caveat worth holding onto rather than burying: AI-application-layer gross margins reportedly run 0–30% against >80% for traditional SaaS (GitHub Copilot's ~$80/user/month cost against ~$10 pricing is the commonly cited example) — leaner headcount does not automatically mean healthier unit economics, so neither half of this pattern should be read as unambiguously bullish.
Section 14
Industry-by-Region Deep Dive
Section 6 covers each region at the aggregate level. This section goes one layer deeper: five leading industries per region, each assessed on the same five dimensions — current trends, notable named startups, funding and valuation data, specific government support programs (not generic "the government supports startups" statements), and innovation/patent activity. Where a clean aggregate figure for one of these dimensions doesn't exist in current trackers, that is stated plainly as a data gap rather than papered over with an invented number — consistent with this report's approach throughout.
14.1 India
Fintech
India's fintech recovery is real but increasingly concentrated at the top: H1 2026 funding reached $2B across 106 rounds (+42% YoY), yet 80% of that capital went to late-stage rounds while deal count kept falling. UPI now carries roughly 85.5% of India's digital transaction volume, the structural backbone under the sector's deal share, and two fintech IPOs (Kissht, Turtlemint) alongside two new unicorns (Square Yards, KreditBee) in H1 2026 signal a maturing rather than purely early-stage market.
- Notable companies: Cred (credit-card bill payment and rewards, $900M Series H in H1 2026 — the largest single India fintech round of the half); KreditBee (collateral-free digital lending, $280M Series E, ~$1.5B valuation); Juspay (payment orchestration infrastructure, ~$1.2B valuation); Neo Group (HNI-focused wealth management, ~$1.08B valuation).
- Funding & valuations: H1 2026: $2B across 106 rounds, +42% YoY, nearly double H2 2025's $1.1B. Stage split is stark — late-stage 80% ($1.6B), early-stage 18%, seed under 4% — while fintech M&A fell 56% YoY, suggesting consolidation is cooling even as fresh investment accelerates.
- Government support: RBI's cohort-based Regulatory Sandbox and newly recognized fintech Self-Regulatory Organisation (SRO-FT) are formalizing industry governance; the Account Aggregator framework now links ~160 million accounts across 17 AAs; Digital Rupee (CBDC) pilots cover 19 banks and 7 million users, including state-level targeted-subsidy pilots in Gujarat and Andhra Pradesh; RBI's own AI fraud-detection tool, MuleHunter.ai, is live at 21 banks; and the Payments Infrastructure Development Fund continues subsidizing PoS/QR acceptance in underserved regions.
- Innovation & patents: No clean sector-specific patent count for Indian fintech exists — a genuine data gap rather than a sign of low activity. The clearer signal is regulatory-built product innovation: MuleHunter.ai is a rare case of a central bank shipping its own production AI fraud tool, and RBI's Unified Markets Interface pilot for wholesale-CBDC-based asset tokenization is a genuine regulatory first.
Enterprise SaaS & Applied AI
India's AI segment is mid-spike: Q1 2026 alone saw Indian AI startups raise $3.94B — more than six times all of 2025 — driven by a sovereign-AI push toward indigenous LLMs and AI-cloud infrastructure rather than pure application-layer SaaS. The sector is also shaking out: Krutrim, India's first GenAI unicorn, pulled back from building its own AI chips and models to focus on the more defensible AI-cloud-services business and just posted its first profit, while AI-native product companies are scaling unusually fast (coding startup Emergent reached unicorn status about 13 months after launch).
- Notable companies: Sarvam AI (sovereign Indic-language LLMs, $234M Series B led by HCLTech, $1.5B valuation); Krutrim (Ola-backed AI cloud/compute infrastructure, ~$300M+ raised, pivoted from chips/models to cloud services); Emergent (AI "engineering team in a box," $130M Series C, $1.5B valuation ~13 months after founding); Neysa (GPU cloud/AI infrastructure, $600M equity plus ~$600M planned debt to deploy 20,000+ GPUs).
- Funding & valuations: Q1 2026: $3.94B into Indian AI startups, over 6x all of 2025. A clean, SaaS-only figure isolated from consumer AI, infrastructure, and application-layer AI was not found in current trackers — a genuine category gap, not a sign SaaS funding is small.
- Government support: The IndiaAI Mission (Rs 10,371.92 crore, ~$1.25B) is the central vehicle, with Rs 4,563 crore earmarked for compute: 34,000 GPUs offered at 42% below market rates, eligible national-priority projects getting up to a further 40% subsidy, and capacity targeted to reach 100,000 GPUs by end-2026. Sarvam AI was selected under the Mission as India's sovereign LLM builder and released open-weight Sarvam-30B/105B models in February 2026, alongside a startup credits and tooling program launched the following month.
- Innovation & patents: Sarvam's open-weight sovereign LLM release is a genuine first for India-built large-scale language models. No clean AI/SaaS-specific patent aggregate was found; India's economy-wide patent filings are up 44% over five years and rank 6th globally (WIPO, 2025), though that figure is not AI-specific and shouldn't be read as one.
Electric Vehicles & Clean Mobility
EV startup funding rose 27% in 2025 to $1.4B, but the composition is the real story: late-stage funding jumped 105% YoY while early-stage funding nearly halved and total deal count fell 54% (139 rounds to 65) — investors are writing far fewer, far larger checks. Battery-swapping and commercial-vehicle manufacturing are pulling the largest single checks, and four EV-sector IPOs in 2025 mark the category's shift from pure venture funding toward public markets.
- Notable companies: Ather Energy (electric scooters, ~$1.4B IPO plus a further $125M share/warrant issue); Euler Motors (electric commercial three/four-wheelers, Series E combining $47M equity and $29.3M debt, Hero MotoCorp holds ~32.5%); Battery Smart (EV battery-swapping network, $19.5M Series C at a ~$430M valuation ahead of a planned IPO); Erisha E Mobility (EV manufacturer, $1B from a single UAE investor to fund UAE/Europe/Africa expansion).
- Funding & valuations: 2025: $1.4B across 65 rounds (+27% YoY). Late-stage funding: $1.1B (+105% YoY); early-stage: $226M (-49%); seed: $61M, down from $129M. Total investor count contracted from 150 (2024) to 70 (2025 YTD), with first-time investors roughly halving — capital is concentrating with fewer, more established backers even as headline dollars grow.
- Government support: The PLI Auto Scheme has supported incentive claims on over 13.61 lakh EVs (13-18% incentives for EV/hydrogen-fuel-cell components, conditional on 50% domestic value addition), driving ₹35,657 crore in cumulative investment and ~49,000 jobs since 2021; the PM E-DRIVE scheme continues subsidizing electric two/three-wheelers and e-rickshaws as FAME-II's successor, though a clean, sourced budget figure specific to PM E-DRIVE was not confirmed and is not stated here to avoid inventing one.
- Innovation & patents: No clean EV-specific patent aggregate for India was found — flagged as a genuine gap. Qualitative signals are real: rapid standardization of battery-swapping networks, continued in-house battery/motor R&D ahead of Ather's IPO, and Euler's commercial-vehicle platform engineering for last-mile logistics.
AgriTech
Indian agritech funding fell ~30% in 2025 to about $160M, continuing a multi-year funding winter — but the more important shift is qualitative: several firms (Arya.ag, Nutrifresh Farms, Poshn) turned profitable and the sector is consolidating (the Unnati–Gramophone merger) as capital-efficiency replaces growth-at-any-cost. Agritech remains structurally under-capitalized relative to its economic weight, drawing only ~2% of India's total startup venture funding since 2020.
- Notable companies: Arya.ag (agri-commodity financing and post-harvest storage, $80M Series D, turned profitable); AgroStar (farmer-facing inputs and advisory e-commerce, $30M raised); FarMart (B2B grain/commodity sourcing, reported in talks for up to $40M); DeHaat (full-stack farm-to-fork platform, ~$270M raised to date, one of the sector's most-funded names).
- Funding & valuations: 2025: ~$160M, down ~30% YoY. Cumulative 2020-2025: $2B across 253 deals. All-time most-funded names: Ninjacart ($370M), WayCool ($307M), DeHaat ($270M), Arya.ag ($254M), AgroStar ($150M). The sector's ~2%-of-total-VC-funding share since 2020 is itself a notable data point on how small agritech remains relative to fintech or SaaS.
- Government support: The Digital Agriculture Mission (Rs 2,817 crore total, ~Rs 1,940 crore centrally funded) rests on three pillars — AgriStack (Aadhaar/land-record-linked farmer IDs), the Krishi Decision Support System, and Soil Profile Maps. Over 4.85 crore Farmer IDs had been issued as of March 2025 against an 11-crore target for 2026-27, feeding streamlined access to PM-KISAN, crop insurance, and Kisan Credit Card loans; the government has also deployed a Kisan e-Mitra AI chatbot and a National Pest Surveillance System.
- Innovation & patents: No clean agritech patent aggregate for India was found — flagged as a genuine gap rather than low innovation. AI-based pest/disease detection and satellite crop-intelligence platforms are seeing growing deployment, and the government's own Kisan e-Mitra chatbot and pest-surveillance system are first-of-kind public-sector agri-AI tools at national scale — arguably the sector's biggest "innovation" story right now is business-model discipline rather than patentable product IP.
Space Tech & Deep Tech
India's private space sector hit a genuine inflection point in 2026: Skyroot Aerospace's Vikram-1 became the first privately-built Indian rocket to reach orbit (July 18, 2026), six years after India opened orbital launch to private players. Cumulative sector funding has grown roughly 20x in five years (from $43M in 2021 to $871M by mid-2026), though the top 10 startups still account for over 60% of all capital, and late-stage funding only appeared for the first time in 2025 — the sector remains structurally early relative to fintech or AI.
- Notable companies: Skyroot Aerospace (private orbital launch vehicles, $150M total including a $50M Series C, unicorn status, launched Vikram-1); Pixxel (hyperspectral earth-observation satellites, $96M+ raised); Agnikul Cosmos (3D-printed rocket engines/small-satellite launch vehicles, $76M raised, IN-SPACe authorized); Digantara (space situational awareness, $67M raised including a $50M Series B).
- Funding & valuations: Cumulative spacetech funding: $871M across 241 rounds/285 companies as of July 2026, up from $43M in 2021. 2025 alone: $200M across 53 rounds. Top 10 startups: $548M+ (over 60% of all capital) — a strong concentration signal. Bengaluru dominates ($495M across 106 rounds) ahead of Hyderabad and Chennai.
- Government support: IN-SPACe has granted 113 authorizations to 52 non-government entities, including 18 startups; a dedicated Rs 1,000 crore Space Sector Venture Capital Fund received SEBI approval in October 2025 and had disbursed Rs 18,893 lakh cumulatively by July 2026; Cabinet approved a space-sector FDI policy amendment permitting up to 100% foreign investment in select sub-activities; and IN-SPACe gives authorized private players access to ISRO facilities and launch infrastructure. Two confirmed commercial launches are projected for FY2026-27, rising to six-plus in FY2027-28.
- Innovation & patents: Skyroot's Vikram-1 orbital launch is an unambiguous first-of-kind milestone. No clean space-tech-specific patent aggregate for India was found — a genuine gap distinct from the broader economy-wide patent surge (6th globally, +44% over five years per WIPO), which should not be read as a space-tech-specific signal.
14.2 United States
Frontier AI & Foundation Models
Capital concentration in US frontier labs reached extreme levels: AI captured over half of all global VC dollars in 2025 (PitchBook), and foundational-model funding alone hit $178B across just 24 deals in Q1 2026 — double all of 2025's $88.9B/66 deals. The market is bifurcating sharply: non-AI startups report serious difficulty raising, while OpenAI, Anthropic, and xAI each closed tens-of-billions rounds within months of each other, and model releases now ship at a near-monthly cadence.
- Notable companies: OpenAI (ChatGPT/GPT-5, ~$122B combined raised across Feb/Mar 2026 rounds); Anthropic (Claude family, $30B Series G at a $380B post-money valuation, ~$64B raised since 2021); xAI (Grok, $20B Series E, ~$42.7B total funding); Safe Superintelligence (pre-product AGI-safety lab, fundraising at a reported ~$30-32B valuation with no shipped product); Perplexity AI (AI search, ~$200M raised, ~$20B valuation).
- Funding & valuations: AI pulled in $192.7B of US VC in 2025 (PitchBook/Bloomberg), the largest single-sector share on record. Foundational-model funding specifically more than doubled from $88.9B/66 deals (FY2025) to $178B across just 24 deals (Q1 2026 alone). Anthropic's $380B post-money (up from ~$183B in 2025) is one of the sharpest single-year valuation markups in this entire report.
- Government support: The White House's Genesis Mission executive order (Nov 2025) directs the DOE and National Laboratories to build a closed-loop AI/supercomputing platform for scientific discovery, with over $5B committed toward biotech, nuclear, quantum, and semiconductors. Separate 2025-2026 executive orders push a lighter-touch federal AI regulatory posture and seek to preempt conflicting state rules, while the privately financed Stargate compute initiative continues to be referenced as the administration's flagship AI-infrastructure buildout.
- Innovation & patents: No single clean aggregate of US AI patent filings exists across trackers — flagged as a genuine data gap rather than low activity; law-firm trend reports describe a continued surge in AI-related applications through 2025-2026. Product-level innovation is unambiguous: multiple frontier labs shipped major flagship models in the same window (Claude Opus 4.5, GPT-5-series updates, Gemini 3), and Stargate-linked data-center announcements represent first-of-kind compute commitments at multi-gigawatt scale.
Defense Tech
US defense tech is in its most capital-intensive phase yet, driven by doctrine shifts toward autonomy, mass-produced munitions, and software-defined weapons systems. Venture funding went from a record $8.8B in 2025 to nearly $13.6B in just the first ~4.5 months of 2026 — on pace to more than double 2025 — concentrated in autonomous systems/drones, decision-intelligence software, and space domain awareness. Anduril has emerged as the sector's clear bellwether, doubling its valuation twice within about a year.
- Notable companies: Anduril Industries (autonomous weapons/Lattice AI decision software, $5B Series H at a $61B valuation, up from $30.5B less than a year earlier); Saronic (autonomous naval vessels, $1.75B Series D, ~$2.6B total raised); Castelion (mass-producible hypersonic missiles, $350M Series B, ~$13B valuation by August 2026 up from ~$1B a year prior); Shield AI (autonomous fighter-pilot/drone AI, $2B raised, ~$12.7B valuation).
- Funding & valuations: Defense tech VC funding: a record $8.8B in 2025, then ~$13.6B through mid-May 2026 alone. Aggregate tracked funding across 60+ companies exceeds $33B, split roughly across autonomous systems/drones (>$7.2B), AI/decision-intelligence software (>$5.8B), and space/satellite tech (>$4.5B). Valuation markups have been extreme and fast — Anduril doubled in under a year; Castelion went from ~$1B to $13B in about a year.
- Government support: The Pentagon's Replicator initiative (Defense Innovation Unit) is designed to field thousands of attritable autonomous systems, awarding its first software contracts to nontraditional vendors and continuing into 2025-2026 despite reported delivery delays. SBIR/STTR remains the primary non-dilutive channel for early-stage defense startups, with a 2025-2026 DoD push to modernize the program for nontraditional entrants; the Defense Innovation Board's "Scaling Nontraditional Defense Innovation" report (Jan 2026) documents structural efforts to move commercial dual-use startups into programs of record faster.
- Innovation & patents: No clean aggregate of defense-tech patents filed in 2025 was found — a genuine data gap, since much frontier defense work is filed under trade-secret or classified protection rather than published patents. Qualitative first-of-kind signals are strong: Castelion's move toward mass-producible hypersonic missile manufacturing, Saronic's uncrewed surface combatants moving from prototype to production-scale naval contracts, and Anduril's Lattice autonomy stack extending across air, sea, and software domains.
Biotech & Healthtech
US digital health/biotech funding rebounded strongly in 2025, but the rebound is heavily AI-concentrated: AI-enabled companies captured 54% of all digital health dollars (up from 37% in 2024) despite being only half of deals, commanding roughly a 19% average deal-size premium (61% at Series C). Traditional (non-AI) biotech/healthtech is comparatively capital-starved, mirroring the bifurcation seen in broader AI investing.
- Notable companies: Xaira Therapeutics (AI-native drug discovery, $1B Series A — among the largest biotech launches ever); Abridge (AI medical-scribe/clinical documentation, $250M Series D, valuation doubled to $5.3B); OpenEvidence (AI clinical decision-support/evidence search, valuation up ~6x within the 2025-2026 cycle); Hippocratic AI (generative-AI patient-facing agents, $141M Series B, valuation more than doubled to $3B+).
- Funding & valuations: US digital health VC funding hit $14.2B in 2025 (Rock Health), +35% from 2024's $10.5B, across 482 deals (down 5%) — average deal size rose to $29.3M from $20.7M. Mega-deals (>$100M) numbered 26 and represented 42% of all dollars; the sector minted 15 new unicorns versus 6 in 2024, and Q4 2025 alone was the strongest quarter since Q2 2022.
- Government support: ARPA-H continues issuing SBIR/STTR-style non-dilutive awards for breakthrough health technologies; BARDA remains a major non-dilutive funder for biodefense-relevant biotech via its VITAL proof-of-concept track; FDA continues granting Fast Track and Breakthrough Therapy designations to individual candidates on a rolling, company-specific basis; and the Genesis Mission executive order names biotechnology as one of its priority DOE-coordinated research verticals.
- Innovation & patents: No single clean aggregate of US biotech patents filed in 2025 was identified — a genuine data gap, since patent counts in biotech lag clinical/platform announcements by design. Xaira's AI-driven drug-design platform, OpenEvidence's rapid clinical-adoption curve, and continued FDA expedited designations for AI-assisted diagnostic and therapeutic products all point to accelerating translation of AI methods into regulated clinical products.
Fintech
US fintech funding rebounded on a "fewer, bigger deals" pattern in 2025. Stablecoins moved from a crypto-native niche to mainstream fintech infrastructure following the GENIUS Act's passage, prediction markets (Polymarket, Kalshi) crossed into the fintech mainstream with billion-dollar rounds, and consolidation accelerated at the top — Capital One's acquisition of Brex signals large incumbents choosing to buy rather than build AI-era corporate fintech capability.
- Notable companies: Ramp (AI-powered corporate card/spend management, $500M then $300M raised, valuation up to a reported ~$44B ahead of a possible IPO); Mercury (digital banking for startups, valuation up to $5.2B, positioning as "the go-to bank for AI startups"); Brex (corporate card/expense management, acquired by Capital One for $5.15B); Kalshi (regulated prediction markets, $1B raised at an $11B valuation).
- Funding & valuations: Global fintech VC funding reached $51.8B in 2025 (+27% YoY) across only 3,457 deals — down 23% from 4,486 in 2024 (Crunchbase), the same fewer-bigger-checks pattern seen everywhere else in this report. Marquee 2025 rounds included Polymarket ($2B), Binance ($2B, with Abu Dhabi's MGX investing), and Kraken ($800M at a $20B valuation).
- Government support: The GENIUS Act (the first federal stablecoin law) established a formal regulatory framework requiring full reserve backing and a path to national operation, potentially reducing reliance on state-by-state money-transmitter licensing; the OCC and Federal Reserve have issued follow-on guidance on how banks can custody, issue, or partner on stablecoins under the Act; fintech-crypto M&A tied to GENIUS Act compliance reportedly reached ~$8B in 2025 as firms consolidated to meet its reserve and licensing requirements.
- Innovation & patents: No single clean aggregate of US fintech patents filed in 2025 exists — a genuine data gap, as fintech innovation is more commonly protected via trade secret and rapid product iteration than patent filing. Kalshi and Polymarket's mainstreaming of federally regulated prediction-market contracts, the GENIUS Act enabling the first bank-native federally chartered stablecoin products, and Chime's 2025 Nasdaq IPO validating the neobank model to public markets are the clearer first-of-kind signals.
Climate Tech & Energy
US climate tech is undergoing a sharp structural pivot: federal policy (the One Big Beautiful Bill Act) has severely curtailed IRA-era solar, wind, and EV incentives, while nuclear, geothermal, and carbon capture retain more favorable treatment. Simultaneously, AI-driven data-center electricity demand has become the dominant investment thesis — "data centers" jumped from 3% to 34% of all climate-tech VC funding in H1 2026, overtaking energy generation as the largest vertical, while carbon-removal and low-carbon-fuels startups are in steep decline.
- Notable companies: Fervo Energy (enhanced geothermal, including a 10.5 GW-scale Microsoft power deal, $1.9B IPO); X-Energy (advanced small modular nuclear reactors, $1B IPO); Commonwealth Fusion Systems (commercial fusion power, another $1B raised, $4B total to date); Oklo (advanced micro nuclear reactors for AI data centers, selected for three DOE Reactor Pilot Program projects).
- Funding & valuations: Global climate tech VC funding hit $26.1B in H1 2026 (+55% YoY) even as deal count fell ~25% to a five-year low — another fewer-bigger-checks instance. Series C funding jumped to $10.5B (40% of the total) from ~16% a year earlier; the top 10 deals captured 42% of all funding, led by data-center developer DayOne's $4.5B Series C, alongside Fervo's and X-Energy's billion-dollar IPOs.
- Government support: The One Big Beautiful Bill Act (2025) compresses IRA solar/wind credit eligibility and terminates the EV clean-vehicle credit, while preserving more favorable treatment for carbon capture (45Q, up to $85/ton) and the nuclear 45U credit. DOE's Loan Programs Office continues actively originating debt for nuclear and geothermal developers, and announced a $171.5M geothermal funding opportunity in February 2026; Oklo was separately selected for three DOE Reactor Pilot Program projects.
- Innovation & patents: No single clean aggregate of US climate-tech patents filed in 2025 was identified — a genuine data gap. Fervo's and X-Energy's 2026 IPOs represent first-of-kind public-market validation for enhanced geothermal and advanced modular nuclear respectively, Oklo's continued NRC licensing progress marks a first-of-kind regulatory pathway for micro-reactors, and Commonwealth Fusion's progress toward a demonstration reactor is among the furthest-advanced commercial fusion efforts globally.
14.3 European Union / Europe
Defense Tech & Deep Tech
European defense tech went from niche to mainstream venture category in 2025: defense, security and resilience startups raised roughly €8.7B (+55% YoY, nearly 4x the level five years earlier), now 43% of all European deep-tech funding. Late-stage rounds are the biggest driver (€4.7B, tripling YoY), AI underpins ~44% of all defense/security/resilience funding, and multiple companies (Helsing, Quantum Systems, Tekever) crossed unicorn status within the same 12-18 months — though zero defense-tech IPOs completed in 2025, so exits still run through M&A (at an all-time high) rather than public markets.
- Notable companies: Helsing (Germany — AI/software for autonomous strike drones, EW, naval systems, $1.8B raised at an ~$18B valuation, Europe's largest-ever defense-startup round); Quantum Systems (Germany — autonomous surveillance/reconnaissance drones, $1.2B at an ~$8B valuation plus a €210M Bundeswehr contract); Tekever (Portugal — AI maritime/ISR drones, Portugal's first defense-tech unicorn, in talks for up to €500M at a reported ~€5.5B valuation); Harmattan AI (France — AI-driven UAV/autonomous defense systems, $200M Series B, one of the largest French defense-tech rounds to date).
- Funding & valuations: Estimates vary by scope: Dealroom/Vestbee puts 2025 European defense/security/resilience funding at €8.7B (13% of total European VC, triple the share three years earlier); a narrower deep-tech-focused tally puts pure "defense startup" funding at €3.5B (nearly double 2024). Globally, aerospace & defense funding reached ~$19B in 2025 (nearly double 2024), with Europe capturing a growing share; M&A activity hit an all-time high even with zero IPOs.
- Government support: The EU's European Defence Industry Programme received final Council approval in December 2025 and adopted a €1.5B work programme in March 2026; the NATO Innovation Fund (€1B+, 24 countries) expanded its early-stage vehicle with a new €197M fund in mid-2026; Germany established a state-backed investment fund in July 2026 letting the federal government take direct equity stakes in defense/dual-use startups alongside KfW and private VCs; France continues channeling its France 2030 sovereignty program (part of a €13B tech-sovereignty push) into dual-use deep-tech scale-ups.
- Innovation & patents: No EPO category isolates "defense" patents specifically, and adjacent readings of the same 2025 EPO Patent Index disagree on growth rates for related fields (e.g., semiconductors cited at both +30.3% and +7.6% depending on category definition) — flagged rather than resolved. Product-first signals are stronger: Quantum Systems' Falke/Strila systems entering Bundeswehr and Ukrainian service, Tekever's AR5 maritime drone scaling to UK operations under a reported £400M commitment, and a wave of interceptor-drone/counter-UAS product debuts explicitly aimed at closing Europe's low-cost drone-defense gap.
Climate Tech & Energy
Climate tech is one of the few European sectors showing genuine resilience through the 2025-26 VC downturn — funding fell only modestly (~-6% YoY versus ~30% declines across broader VC) even as fund formation surged, with Europe attracting over $50B of new climate-tech-dedicated fund capital in 2025, more than half the global total. The center of gravity is shifting from first-generation carbon-offset plays toward hard infrastructure — heat pumps, battery recycling, grid/energy-as-a-service, and industrial thermal storage — alongside a re-emergence of next-generation nuclear.
- Notable companies: Aira (Sweden — residential heat pumps/home electrification, ~€621M raised across five rounds); cylib (Germany — closed-loop lithium-ion battery recycling, ~€156M raised); Ostrom (Germany — digital green-energy retail/smart-grid tools, ~€40M raised); Stellaria (France — molten-salt nuclear reactor developer, ~€23M raised, part of a broader European bet on next-gen nuclear).
- Funding & valuations: Figures vary by scope: fund-formation tracking puts 2025 European climate-tech fund capital at >$50B (about half the global $103B total); direct deal-flow tracking puts 2025 European climate-tech VC/growth investment at €8.2B, down only ~6% YoY — a far gentler decline than the broader European VC market. The EU's carbon-market-financed Innovation Fund separately unlocked €2.7B for 54 large-scale clean-industry projects across 17 countries in its 2026 tranche.
- Government support: The EU Innovation Fund (financed by ETS revenues) is the flagship program, having just closed its €2.7B/54-project 2026 tranche; Germany's Climate and Transformation Fund and its broader €500bn special infrastructure/climate-neutrality fund (agreed 2025) remain the largest national vehicles; the EIB Group set up a new EIB Global climate fund in late 2025 with Germany and Luxembourg as pioneer contributors; and Horizon Europe's 2026-2027 work programme carries roughly €14B, a portion flowing to climate/energy R&D calls.
- Innovation & patents: EPO's 2025 Patent Index shows climate-adjacent categories among the fastest-growing filing areas — electrical machinery/energy applications up 12.4%, with a 25.7% surge specifically in battery-technology filings — though no single "European climate-tech patent count" aggregate spans all subsectors, so this is directional rather than exact. 2025-26 saw first-of-kind commercial launches in molten-salt nuclear, natural-fiber load-bearing construction materials, and industrial thermal-energy storage reaching early commercial deployment.
Fintech
European fintech funding stabilized rather than boomed: full-year 2025 came in around $15.6B across 742 deals, but Q1 2026 data show a bifurcation — mega-rounds (>$100M) collapsed 55% YoY while sub-$100M deals grew 22%, meaning capital is spreading to more, smaller, leaner companies rather than concentrating in a few giants. Investor focus has rotated from consumer neobanking toward B2B infrastructure — embedded finance, virtual IBANs, AI-driven finance tooling, and vertical SME lending.
- Notable companies: Ominimo (Hungary — AI-underwritten motor insurtech across CEE, unicorn status on a $22.5M Series B at a ~$1.6B valuation); 9fin (UK — AI-native debt capital markets analytics, $170M Series C at a ~$1.3B valuation); Allica Bank (UK — digital business bank for established SMEs, $155M Series D at a ~$1.2B valuation); Moneybox (UK — digital wealth/round-up investing, ~$1.1B valuation via a £45M secondary sale).
- Funding & valuations: Full-year 2025 European fintech funding: ~$15.6B across 742 deals. Q1 2026 fell to $3.8B (-31% YoY) even as deal count rose 4%, with average deal size down 34% to $19.6M — consistent with the mega-round pullback offsetting growth in smaller rounds; full-year 2026 is tracking to a mild ~3% decline from 2025 on current run-rate.
- Government support: The EU's Markets in Crypto-Assets Regulation (MiCA) is now in force and reshaping the stablecoin/crypto-asset segment, with the European Banking Authority actively regulating asset-referenced and e-money tokens under it. The European Investment Fund's European Tech Champions Initiative — €3.9B initial resources (ETCI 1) had invested €3.5B into funds and backed 47 EU companies (12 unicorns) as of August 2026; ETCI 2.0 (a further €1.25B committed in December 2025, targeting €80B mobilized) launched in July 2026 with fintech named as a target sector alongside AI, deep tech, and life sciences.
- Innovation & patents: No EPO-published aggregate specifically covers European fintech patents — payments/blockchain/DeFi IP is tracked mostly by private trackers rather than EPO's own dashboard, a genuine data gap. The clearer 2025-26 innovation signal is regulatory-driven product design: MiCA compliance has pushed several EU stablecoin and e-money-token issuers to build first-of-kind EU-compliant reserve and disclosure architectures specifically to differentiate from non-MiCA-compliant competitors.
Enterprise AI & Legal Tech
European enterprise AI had its strongest funding quarter in four years in Q2 2026 ($24B, +67% YoY), driven by "sovereign AI" positioning — European enterprises and governments paying a premium for AI infrastructure with EU data residency and independence from US/Chinese cloud providers. That thesis just triggered the sector's first major consolidation: Cohere's ~$20B acquisition of Germany's Aleph Alpha, creating what both companies call "the credible European alternative" to OpenAI/Anthropic/Google. Legal tech is a smaller, fast-maturing adjacent category, with AI-native contract and research tools displacing older incumbents on genuine time-savings claims.
- Notable companies: Mistral AI (France — open-weight sovereign foundation models, €3B/$3.5B raised at a $24B valuation led by Samsung, 125+ enterprise customers including Airbus and BMW); Cohere/Aleph Alpha (Germany/Canada — merged sovereign-AI platform, ~$20B combined valuation, Schwarz Group's STACKIT providing sovereign-cloud infrastructure); Luminance (UK — AI legal document review/negotiation, 700+ law firms, launched an "Autopilot" end-to-end negotiation feature); Leya (Sweden — AI legal research/drafting, $20M Series A led by Redpoint).
- Funding & valuations: Europe-wide AI-heavy venture funding hit $24B in Q2 2026 (+67% YoY), dominated by a handful of mega-rounds rather than broad-based growth — Atomico's State of European Tech 2025 separately cites a roughly $375B structural funding gap versus the US. In legal tech, global funding reached $5.99B in 2025 (+22% YoY) across 292 deals (-27%, i.e., fewer but larger checks); Europe's largest legal-tech story of the period was an exit — Barcelona-founded vLex acquired for $1B.
- Government support: The EU's InvestAI initiative (launched April 2025) commits roughly €200B in combined EU/member-state/private capital to AI, including €20B for "AI gigafactories," with a further EU AI Gigafactories call unlocking over €30B in associated investment. The EU AI Act's phased obligations (high-risk system and GPAI-model rules among the latest waves) are creating compliance-driven demand that is now a direct commercial tailwind for "EU-compliant by design" vendors — exactly the positioning Cohere/Aleph Alpha and Mistral sell to enterprise customers.
- Innovation & patents: EPO's 2025 Patent Index shows "computer technology" filings (the category capturing most AI/software patents) up 9.8%, with China alone now accounting for 12% of all AI-related EPO submissions — European AI patent share is growing but sits inside a globally intensifying filing race, not a European lead. The clearer 2025-26 signals are product firsts: Mistral's $830M debt-financed data-center buildout, Luminance's Autopilot contract-negotiation agent, and the Cohere/Aleph Alpha merger's bet that sovereign, on-premise-deployable frontier models are a genuine technical differentiator.
Semiconductors & Quantum Computing
European quantum computing had a breakout 2025 — funding peaked at roughly €1.5B (+~170% YoY), European startups captured 47.5% of global quantum venture funding in Q1 2025 alone, and IQM became Europe's first quantum-computing unicorn. Semiconductors are moving on a slower, more capital-intensive, policy-driven timeline: the EU Chips Act has mobilized over €80B against an original €43B target, explicitly aiming for "indispensability" in specific niches rather than leading-edge manufacturing self-sufficiency, with a "Chips Act 2.0" now moving through Brussels.
- Notable companies: IQM Quantum Computers (Finland — superconducting quantum computers, ~€300M round, Europe's first quantum-computing unicorn, valuation >$1B); Pasqal (France — neutral-atom quantum computing, in talks for ~€200M at a valuation exceeding $1B); Alice & Bob (France — cat-qubit error-corrected quantum computing, ~€100M raised); SiPearl (France — sovereign energy-efficient CPUs for European supercomputing/AI, €90M Series A, shipped its first Rhea1 HPC processor in 2026 alongside a sovereign defense processor).
- Funding & valuations: European quantum funding: ~€1.5B in 2025 (+~170% YoY), with dedicated new capital forming behind it (Quantonation's €220M quantum fund; Danish manager 55 North targeting €300M for what would be the sector's largest-ever dedicated fund). Notable exit: Oxford Ionics (UK) acquired by US-listed IonQ for over $1B. On chips, the EU Chips Act has driven >€80B in mobilized investment, including Germany's Dresden ESMC fab (>€10B) and France's €2.9B STMicroelectronics/GlobalFoundries project — though Europe still lacks a comparably rigorous VC-style semiconductor-startup funding aggregate the way quantum now has one, since most chips capital is large-scale industrial/state co-investment rather than startup venture rounds.
- Government support: The EU Chips Act (2023) and its proposed "Chips Act 2.0" successor target design centers, pilot lines, and competence hubs; combined mobilization is already double the original €43B target. On quantum, the EU and its 27 member states have committed more than €11B in public funding over the past five years, and the European Commission published a new strategic quantum framework in mid-2026 aiming for European quantum leadership by 2030; France's national quantum plan committed roughly €500M specifically to quantum computing.
- Innovation & patents: EPO's 2025 Patent Index shows quantum computing as the single fastest-growing filing category tracked, up 37.9% — a genuinely outsized figure versus most other tech fields — while semiconductor-specific filing growth is reported inconsistently across sources (+30.3% vs +7.6% depending on category definition), flagged rather than resolved. SiPearl's Rhea1 — Europe's first sovereign ARM-based CPU for exascale/AI supercomputing — is the clearest first-of-kind product signal, an explicit bet on European chip-design independence rather than manufacturing competition with TSMC or Intel.
14.4 EMEA (Gulf / MENA)
Fintech
Fintech remains MENA's single largest tech-investment sector: Q1 2025 fintech funding was up 362% YoY and H1 2025 regional VC hit $1.5B, its strongest first half since 2022. Saudi Arabia overtook the UAE for total capital raised for the first time, driven by mega later-stage BNPL/lending rounds, while the UAE keeps the region's largest fintech company base and leads on regulated stablecoins, tokenization, and Islamic fintech. Egypt's fintech story is now dominated by one consolidating giant, MNT-Halan, rather than a broad early-stage pipeline.
- Notable companies: Tabby (Saudi/UAE — BNPL-turned-banking app, $4.5B valuation via an October 2025 secondary sale, planned IPO); Tamara (Saudi — BNPL, Saudi's first fintech unicorn, secured a record $2.4B Goldman Sachs-backed receivables facility); MNT-Halan (Egypt — digital lending super-app, $1.4B valuation as of June 2026); Lean Technologies (Saudi — open-banking infrastructure, $67.5M Series B, General Catalyst's first Saudi investment).
- Funding & valuations: No single clean "MENA fintech-only, full-year" total was confirmed for 2025/H1 2026 — a genuine data gap. What is solid: Q1 2025 fintech investment rose 362% YoY; MENA-wide VC hit $1.5B in H1 2025 with fintech the top sector; Saudi Arabia "reclaimed the top position" in MENA startup financing specifically on fintech, later-stage activity. Individual deal sizes are large and well documented, consistent with a later-stage-concentrated market.
- Government support: The UAE central bank's Payment Token Services Regulation establishes a framework for AED-backed stablecoins; Saudi's SAMA launched a new open-banking licensing framework in 2026 alongside the Fintech Saudi regulatory sandbox under Vision 2030's Financial Sector Development Program; DIFC's Innovation Testing Licence and ADGM's RegLab in Dubai/Abu Dhabi provide regulatory sandboxes; and UAE Golden Visa eligibility extends to startup founders and entrepreneurs.
- Innovation & patents: No consolidated regional fintech-patent dataset exists — a genuine data gap. Qualitative signals are strong: 2025 UAE fintech commentary names AI, tokenization, and Islamic finance as the three dominant innovation themes; the CBUAE's dirham-backed stablecoin regime is a regional regulatory first; and SAMA's open-banking licensing launch is a first-of-kind regulatory product in the Kingdom.
PropTech & Real Estate Tech
Dubai is positioning itself as the region's real-estate tokenization pioneer through the Dubai Land Department's multi-phase pilot with Ctrl Alt/Prypco, while established portals like Property Finder attract sovereign-anchored mega-rounds rather than pure VC money. Saudi Arabia is digitizing land administration and housing delivery (REGA's Saudi PropTech Hub, ROSHN) to keep pace with giga-project-driven housing demand. The UAE leads on funding volume and platform maturity; Saudi is the fastest-growing market on state housing programs; Egypt's proptech scene remains comparatively thin.
- Notable companies: Property Finder (UAE — MENA's largest real-estate listings portal, $170M raised, led by Mubadala); Keyper (UAE — rental/property-management digitization, $11M Series A); Stake (UAE/Saudi — fractional real-estate investment, $31M raised to expand into Saudi and the US); Prypco/Prypco Mint (UAE — tokenized real-estate investment, partnered with DLD on what is billed as "MENA's first tokenized real estate project").
- Funding & valuations: No single clean "MENA proptech" total for 2025/H1 2026 was confirmed — a genuine data gap. Named 2025-2026 rounds sum to roughly $200M+ (Property Finder $170M, Stake $31M, Keyper $11M), concentrated almost entirely in the UAE — a much smaller, more concentrated pool of capital than fintech or e-commerce/logistics.
- Government support: The Dubai Land Department's Real Estate Tokenisation Project (pilot launched 2025, Phase 2 activated for secondary-market trading in 2026) targets a $16B tokenized property market by 2033, built on the XRP Ledger with Ctrl Alt under VARA's crypto framework; REGA's Saudi PropTech Hub is a dedicated regulatory/digital platform for real-estate technology; Saudi Vision 2030's Housing Program (Sakani) and the PIF-backed giga-developer ROSHN Group are driving state demand for proptech and construction-tech adoption.
- Innovation & patents: No patent-filing dataset specific to MENA proptech exists — a genuine data gap. The DLD/Ctrl Alt "Prypco Mint" launch is a concrete first-of-kind: MENA's first tokenized real-estate project, with its Phase 2 rollout (secondary-market trading of tokenized property) a genuine regulatory and product first for the region.
Logistics & E-commerce
Sovereign capital now defines Gulf e-commerce and logistics: noon, the region's largest e-commerce platform, raised $500M from PIF-backed investors ahead of a potential IPO, and Saudi's PIF is actively exploring merging its logistics assets into a single national "logistics giant." Financing structures are shifting toward debt/securitization for scaled players — UAE's TruKKer secured a $300M cross-border trade-receivables securitisation facility rather than a traditional equity round — while earlier-stage logistics-tech funding stays comparatively modest.
- Notable companies: noon (UAE/Saudi — pan-regional e-commerce marketplace, $500M raised from PIF-backed investors ahead of a potential IPO); TruKKer (UAE/Saudi — digital freight/trucking marketplace, up to a $300M securitisation facility from ADCB); Cartlow (UAE — reverse-logistics/refurbished-goods platform, $18M raised); MaxAB (Egypt — B2B e-commerce and grocery distribution, earlier $40M Series A, part of a broader B2B logistics-tech scene still drawing active investor interest).
- Funding & valuations: No single clean "MENA logistics & e-commerce" aggregate for 2025/H1 2026 was confirmed — a genuine data gap. What is concrete: noon's $500M raise and TruKKer's $300M facility together represent roughly $800M in named 2025-2026 sector financing, on top of MENA's broader startup-funding record of $7.5B for full-year 2025 and $1.7B in H1 2026, of which logistics/e-commerce was a significant but not separately isolated component.
- Government support: Saudi PIF's active 2026 exploration of consolidating national logistics assets into a single "logistics giant" is positioned as a strategic industrial play, not just a portfolio move; Saudi Vision 2030's National Industrial Development and Logistics Program (NIDLP) is the umbrella program for turning the Kingdom into a global logistics hub; PIF-backed investors' direct equity role in noon ahead of its planned IPO mirrors the same "national champion" playbook seen in fintech and clean energy.
- Innovation & patents: No consolidated regional patent dataset for logistics/e-commerce technology exists — a genuine data gap. The shift to large-scale securitisation financing (TruKKer/ADCB) is itself a structural first for a MENA digital-freight platform at this size, and PIF's proposed logistics-asset consolidation would be a first-of-kind vertical integration of ports, rail, and freight under one sovereign entity if it proceeds.
Clean Energy & Hydrogen
This sector is dominated by state-scale infrastructure rather than a conventional VC-backed startup pipeline. MENA overall is a $642B clean-industry investment pipeline across ~84 projects, with green hydrogen alone mapped at $150B+ in regional projects. Saudi Arabia leads on flagship green-hydrogen megaprojects — NEOM Green Hydrogen Company's $8.4B plant was 80-90% complete through early-to-mid 2026, with commercial output now targeted for 2027. The UAE leads on portfolio breadth through Masdar, which committed ~$15B to global clean-energy projects in 2025 and secured financing for a $6.1B "round-the-clock" clean-power project in 2026.
- Notable companies: Yellow Door Energy (UAE — distributed solar/energy-efficiency for corporate clients, ~$492M raised cumulatively); NEOM Green Hydrogen Company (Saudi/NEOM — building the world's largest green-hydrogen plant, ~$8.4B, 80-90% complete); Masdar (UAE — state clean-energy champion, ~$15B committed in 2025, $6.1B project financing in 2026). Few pure early-stage startups with disclosed rounds surfaced in this category — the sector's investable entities are overwhelmingly sovereign-backed developers and project companies rather than VC-stage ventures, a structural feature worth naming plainly rather than papering over with unverifiable startup names.
- Funding & valuations: No single "MENA clean-energy/hydrogen startup" VC total for 2025/H1 2026 was confirmed — arguably a structural feature of the sector (capital flows as project finance and sovereign equity, not seed/Series rounds) rather than a tracking gap. What is solid: the $642B clean-industry pipeline, $150B+ mapped hydrogen projects, Masdar's ~$15B 2025 commitment and $6.1B 2026 project financing, and NEOM's $8.4B hydrogen-plant cost.
- Government support: The UAE's National Hydrogen Strategy and Hydrogen Leadership Roadmap are tracked by the IEA as formal government policy; NEOM Green Hydrogen Company is a direct PIF/NEOM investment vehicle under Vision 2030; Masdar operates as Abu Dhabi's sovereign clean-energy investment arm, deploying tens of billions domestically and abroad; and joint pilots such as Masdar-EMSTEEL green-steel-via-green-hydrogen are framed as the region's first such project.
- Innovation & patents: No patent-filing dataset for MENA clean energy/hydrogen exists — a genuine data gap. Genuine first-of-kind signals: the Masdar-EMSTEEL pilot is described as the region's first project decarbonizing hard-to-abate steel production via green hydrogen, and Masdar's $6.1B round-the-clock project is framed as a first-of-its-kind firm renewables-plus-storage structure at this scale.
Defense & Aerospace (Gulf sovereign-backed)
This vertical is structurally different from the other four — built almost entirely around sovereign-owned industrial champions rather than VC-backed startups. The UAE's EDGE Group projected ~$5B in 2025 revenue and continues expanding internationally, while Saudi Arabia accelerates industrial localization through GAMI, reaching 24.89% military-spending localization in 2025 against a 50%-by-2030 target. The most significant 2026 development is Saudi Arabia's move into indigenous long-range strike drones via a new US-Saudi joint venture, following heightened regional threat perceptions after the 2026 Iran conflict; the UAE is simultaneously seeding an actual startup layer underneath its state champions via a new Tawazun entrepreneurship program.
- Notable companies: EDGE Group (UAE — state-owned defense/advanced-technology conglomerate spanning drones, missiles, cyber, and electronic warfare, ~$5B projected 2025 revenue); SAMI (Saudi Arabian Military Industries — the Kingdom's PIF-linked sovereign defense manufacturer); ADASI, an EDGE subsidiary (UAE — unveiled JENIAH, described as the UAE's first jet-powered combat drone); the SR2Vector/SkyWasp joint venture (Saudi/US — a new drone factory near Riyadh producing a Shahed-inspired long-range kamikaze drone with a reported ~1,500km range).
- Funding & valuations: No VC-style startup-funding dataset exists for this sector, and constructing one would be misleading — Gulf defense-tech capital moves almost entirely as sovereign equity, state budget allocation, and industrial joint ventures, not equity rounds. What is concrete: EDGE Group's ~$5B projected 2025 revenue and Saudi's defense-spending localization reaching 24.89% in 2025, itself a proxy for capital redirecting into domestic defense-industrial capacity.
- Government support: Saudi Arabia's GAMI localization program targets 50% of defense spending localized by 2030 (24.89% reached in 2025); the UAE's Tawazun Council launched a new entrepreneurship/accelerator program explicitly aimed at growing startups in defense and dual-use technology; the UAE established a new Defence Industrial Free Zone in Abu Dhabi to boost local manufacturing; and EDGE Group's government-brokered international joint ventures (with L3Harris and EM&E) function as formal technology-transfer vehicles tied to UAE state defense policy.
- Innovation & patents: No consolidated regional defense-patent dataset exists — a genuine data gap. Genuine first-of-kind product signals are well documented: ADASI/EDGE's JENIAH is described as the UAE's first jet-powered combat drone, and the SR2Vector/SkyWasp Riyadh factory marks Saudi Arabia's first indigenous production line for a long-range kamikaze strike drone — a notable technical and industrial first for the Kingdom rather than an imported system.
14.5 Africa
Fintech & Mobile Money
Fintech remains Africa's single largest funded tech sector by absolute dollars ($556M in H1 2026, 41% of the continent's $1.37B total), but its share of all capital has fallen from ~60% in 2022 to roughly 25% in 2025 as cleantech and EV-heavy logistics have caught up. Debt, not equity, is doing much of the work (African tech debt was +63% YoY in 2025, 41% of all capital), reflecting a maturing, asset-heavy fintech model. Mobile money is expanding geographically — Safaricom's M-Pesa entered Ethiopia, and Wave became the first non-bank fintech licensed inside WAEMU, then upgraded to a full bank license.
- Notable companies: Flutterwave (Nigeria — payments infrastructure, $100M Series E, $3.2B valuation); MNT-Halan (Egypt — digital lending/BNPL super-app, $90M across two 2026 rounds, ~$1.4B valuation); Moniepoint (Nigeria — business banking/payments, $1B+ valuation on a $110M Series C backed by Google and QED); Wave (Senegal/WAEMU — mobile money, $1.7B valuation, €117M debt round to fund Wave Bank Africa S.A. after becoming the zone's first non-bank e-money licensee).
- Funding & valuations: African fintechs raised $556M in H1 2026 (41% of the continent's $1.37B total) across ~48 funded companies. For full-year 2025, Partech puts fintech equity funding at $769M (25% of all equity funding) within a total African tech market of $4.1B (+25% YoY: $2.4B equity/+8%, $1.6B debt/+63%). A clean fintech-only YoY deal-count comparison for H1 2026 vs H1 2025 was not available in current trackers — flagged as a gap.
- Government support: Nigeria's CBN unveiled a 2026 Fintech Reform Roadmap — a Standing Fintech Engagement Forum, a Compliance-as-a-Service shared reporting platform, a Single Regulatory Window across agencies, and an expanded regulatory sandbox now covering AI, cross-border payments, and embedded finance. The Nigeria Startup Act is still being operationalized (NITDA held an August 2026 session to "activate" long-dormant tax/investment incentives, an acknowledged three-year execution gap). Pan-African: the Pan-African Payment and Settlement System saw Nigerian-participant transaction value jump from $29.2M (2024) to $143.4M (2025); Wave's WAEMU bank license is a landmark mobile-money regulatory precedent for Francophone Africa.
- Innovation & patents: No clean aggregate patent-filing count exists for African fintech — a genuine data gap. CBN's sandbox expansion explicitly targets AI-driven compliance and embedded-finance product firsts, Wave becoming a licensed bank (not just an e-money issuer) is a regulatory/product first, and M-Pesa's Ethiopia launch is telco mobile-money's biggest new-market bet in years — though it generated only ~$77,000 in FY26 revenue against a ~$364M Safaricom group net loss, showing the innovation is commercially unproven so far.
AgriTech
Investment is shifting away from farm-gate consumer apps toward hard infrastructure — cold chain, biodigesters, processing/milling, and payment rails — reflecting investor preference for tangible, revenue-backed assets. The sector remains small and lumpy next to fintech/cleantech: Agri & Food funding was near-negligible in January 2026 (~$200K) before rebounding to ~$55M in February on just two deals. Kenya is the regional hub for agri-innovation; Nigeria's activity is more policy-driven; government and DFI money currently outweighs pure VC as the sector's growth engine.
- Notable companies: Sistema.bio (Kenya-based — biodigesters converting farm waste to biogas, $53M growth round); Agriarche (Nigeria — smallholder supply-chain platform connecting 25,000+ farmers, $1.8M equity plus debt); Lovegrass Ethiopia (teff processing and export, $5M raised); Breadfast (Egypt — grocery commerce with dark-store infrastructure, agri-adjacent, $50M pre-Series C).
- Funding & valuations: Africa's Agri & Food tech sector raised ~$93M in H1 2026 (7% of the continent's ~$1.37B total) across 26 funded companies — modest next to fintech's $556M and logistics' $472M in the same period. A separate tally could name only 12 African agtech startups that have cumulatively raised over $50M since 2016, underscoring how few breakout mega-rounds the sector has produced.
- Government support: The African Development Bank signed a $16.6M grant to IITA in February 2026 launching TAAT-III (Technologies for African Agricultural Transformation, phase III), targeting 37 low-income countries and an additional 14 million farmers, building on a 2018-2025 run that reached ~25M farmers and generated $4B+ in added agricultural value. Kenya's Ministry of Agriculture launched an Agricultural Data, Information and Digital Policy (2026) creating the Kenya Agricultural Digital Information Centre on top of a system already holding records for 7.2M+ registered farmers.
- Innovation & patents: No clean aggregate patent-filing count for African agritech was found — a genuine data gap. AfriScout (a satellite vegetation/water-mapping tool blended with indigenous pastoral knowledge) cut herd mortality by 47% and drove ~80% pastoralist adoption within a year of piloting; TAAT-III's heat-tolerant wheat is already at scale across 35M+ hectares continent-wide — deployment firsts rather than codified IP filings.
CleanTech & Off-Grid Energy
Cleantech is Africa's fastest-growing tech sector by funding growth rate, though trackers disagree on exact totals (one puts 2025 funding at $1.18B, roughly doubling 2024; a narrower cleantech-equity figure is $550M, +186% YoY) — read as directional, not exact. The dominant story is the electric two-wheeler/battery-swap race between Spiro and MAX, now the single largest driver of "logistics/transport" capital continent-wide. Off-grid solar majors (d.light, Sun King) are landing $100M+ mega-rounds, and debt/blended finance is now the default instrument. Kenya is the clear regional hub.
- Notable companies: Spiro (Kenya-HQ, pan-African — EV/battery-swap network, $50M debt atop a reported $327M H1 2026 total raise; 80,000+ e-motorcycles, 2,500+ swap stations across 6 countries); MAX (Nigeria — vertically integrated e-mobility/assembly, $24M raised, profitable in its home market); d.light (Kenya — off-grid solar, $300M raised in 2025); Sun King (Kenya — off-grid solar, $156M raised in 2025).
- Funding & valuations: African climate-tech funding reached $1.18B in 2025 by one tracker's count (vs. a narrower $550M cleantech-equity figure, +186% YoY) — the disparity between trackers is itself worth flagging. In H1 2026, EV-heavy Logistics & Transport took $472M (35% of continental capital), almost entirely thanks to Spiro's single $327M raise (24% of all African funding that half-year).
- Government support: Mission 300 — the AfDB/World Bank flagship launched at the January 2025 Africa Energy Summit — targets connecting 300 million people to electricity by 2030 and mobilizing $238B+ in public/private investment; 12 countries including Nigeria signed National Energy Compacts in the first cohort, with a second 17-country cohort (including Kenya) following later in 2025. The Beyond the Grid Fund for Africa (funded by Sweden, Denmark, Germany's KfW, Norway, and Power Africa) delivered 4.3M new people with electricity access in 2025 — though notably operates in Burkina Faso, DRC, Liberia, Mozambique, Uganda and Zambia rather than the Big Four.
- Innovation & patents: No clean aggregate patent count for African cleantech was found — a genuine data gap. Spiro and MAX have built incompatible, proprietary battery-swap formats — effectively a de facto standards race without a common continental spec — and Nigeria's move to 300MW of domestic solar-panel manufacturing capacity (targeting a 3.7GW regional hub) marks a genuine regional manufacturing first rather than pure import/assembly.
HealthTech
African digital-health equity funding rebounded sharply to $215M in 2025 (+232% YoY) after a 2024 trough, but this looks like normalization after a dip rather than a new expansionary peak, and remains far smaller in absolute terms than fintech or cleantech. Funding is concentrated among a handful of DFI/impact investors, and the Big Four are not automatically dominant here — Francophone Africa captured 68% of 2025 equity funding outside Kenya/Nigeria/South Africa/Egypt. Policy momentum is shifting from stand-alone health apps toward insurance-linked digital infrastructure.
- Notable companies: mPharma (pan-African — pharmacy benefits/drug-supply chain, fresh 2025 backing for Francophone West Africa expansion); Helium Health (Nigeria — hospital EMR/software, $30M Series B); MYDAWA (Kenya — online pharmacy, $20M Series B); Kasha (Rwanda-based, regional — women's health e-commerce, $21M Series B).
- Funding & valuations: African digital-health equity funding: $215M in 2025 (2024: $65M; 2023: $212M), a 232% YoY jump; total funding including debt was ~$224M. No 2025/2026 aggregate deal-count or equity-vs-debt split specific to the Big Four markets was found — a genuine granularity gap.
- Government support: Nigeria's NHIA and the Healthcare Federation of Nigeria agreed in 2026 on enrollment targets requiring 6M+ new enrollees a year, standing up a joint technology/data-integration working group and an "Informal Sector Coverage Fund." Kenya's Digital Health Act (2023, creating a national Digital Health Agency) remains under a Court of Appeal stay even as its 2024-2027 strategy and 2025 procedures operationalize it in parallel — a live regulatory-uncertainty gap. Egypt launched a National Digital Health Strategy 2025-2029 anchored to its Universal Health Insurance architecture; South Africa's prior strategy has expired with no 2025-2029 successor publicly released as of mid-2026.
- Innovation & patents: No clean aggregate patent-filing count for African healthtech was found — a genuine data gap. Zipline's medical drone-delivery network (Rwanda, Ghana, Nigeria, Kenya, Côte d'Ivoire) passed 2 million cumulative deliveries and 120M+ autonomous miles by January 2026, with peer-reviewed impact data (Rwanda: 61% faster blood-product delivery; Ghana: 60% fewer vaccine stock-outs) — though Ghana suspended three centers in November 2025 over ~$15M in unpaid government bills, showing public-payment risk can stall even proven health-logistics innovation.
Logistics & E-commerce
Logistics & Transport was Africa's second-largest funded sector in H1 2026 ($472M, 35% of continental capital), but is now dominated by electric-mobility/battery-swap infrastructure rather than classic freight or e-commerce delivery — Spiro's single $327M raise made up 70% of the entire logistics/transport total. Pure e-commerce equity funding is comparatively thin; most named activity now shows up as embedded logistics or adjacent grocery/quick-commerce rather than stand-alone marketplace mega-rounds. Consolidation continues among first-generation players — Wasoko and MaxAB's prior merger created a combined ~$500M-valued B2B informal-retail platform.
- Notable companies: Spiro (pan-African, Kenya-HQ — EV/battery-swap logistics, $327M raised in H1 2026, the largest single logistics-sector deal on the continent); Wasoko/MaxAB (Kenya/Egypt — merged B2B e-commerce/informal-retail distribution platform, ~$500M combined valuation); Chowdeck (Nigeria — food/grocery quick-commerce, Series A stage); Jumia (Nigeria-founded, pan-African — the continent's largest publicly traded e-commerce operator, included for scale context).
- Funding & valuations: Africa's Logistics & Transport sector raised $472M in H1 2026 (35% of the continent's total) across 27 funded companies — second only to fintech — but heavily distorted by Spiro's single $327M EV mega-deal (70% of the sub-sector); a clean, EV-stripped e-commerce/logistics-only total is not available in current trackers, a genuine data gap rather than an estimate.
- Government support: AfCFTA continues building digital-trade infrastructure relevant to cross-border e-commerce/logistics, including an e-Tariff Book, a non-tariff-barrier reporting mechanism, and the "Smart AfCFTA" digital platform. The Pan-African Payment and Settlement System saw Nigerian-participant transaction value jump nearly 5x YoY (2024 to 2025). Smart Africa runs an active e-Payments-for-Digital-Trade blueprint explicitly targeting cross-border e-commerce payment rails, alongside a Digital ID Blueprint relevant to KYC on logistics/e-commerce platforms.
- Innovation & patents: No clean aggregate patent-filing count specific to African logistics/e-commerce was found — a genuine data gap. Zipline's drone-delivery network (2 million cumulative deliveries, 120M+ autonomous miles by January 2026) is the continent's most mature autonomous-logistics operation, though its Ghana suspension over unpaid government invoices shows commercial/public-payment risk remains a bigger constraint than the underlying technology; the Spiro-vs-MAX incompatible battery-swap standards function as a de facto logistics-infrastructure innovation race even without formal patent disclosure.
14.6 Israel
Cybersecurity
Israeli cybersecurity had a record 2025, with the "Wiz effect" (Google's ~$32B agreed acquisition of the Israeli-founded cloud-security company) pulling a wave of new global VC attention into the sector — for the first time, foreign/global capital in Israeli cyber startups outpaced domestic Israeli VC investment. Funding concentrated in fewer, larger rounds, with AI-native security categories (AI security, endpoint security) growing fastest; the war has been largely orthogonal to this sector's trajectory, and momentum carried into 2026 with 14 Israeli firms named to a global "Rising in Cyber 2026" list — nearly half the list.
- Notable companies: Wiz (cloud security posture management, agreed to be acquired by Google for ~$32B — the largest tech acquisition involving an Israeli-founded company to date); Cyera (AI-driven data security/governance, valuation rocketed from ~$3B to $9-12B within about 18 months); Cato Networks (SASE platform, $359M raised at a $4.8B valuation); Torq (AI-native security-operations-center platform, unicorn status on a $140M raise at a $1.2B valuation).
- Funding & valuations: Israeli cybersecurity funding hit a record $4.4B in 2025 across 130 rounds, up from $4.03B across 89 rounds in 2024 (different trackers report the YoY change as anywhere from +9% to +46% depending on methodology — flagged rather than reconciled). Nine mega-rounds exceeded $200M sector-wide in 2025, including Cyera alone raising $940M across two rounds. Cybersecurity plus generative AI together accounted for roughly 70% of all 2025 Israeli tech capital despite being only ~40% of deals.
- Government support: The Israel National Cyber Directorate published a draft National Cybersecurity Bill in 2026 introducing new statutory obligations and enforcement authorities — a regulatory tightening also expected to seed compliance-driven demand for Israeli cyber vendors. The US Department of Homeland Security agreed a new bilateral cybersecurity R&D partnership with Israel; more broadly, the Israel Innovation Authority's NIS 1 billion (~$270M) Fast-Track Funding Program (cushioning tech firms against a strengthening shekel) and its continued ~$450M channeled into VC funds provide sector-adjacent government backing.
- Innovation & patents: No clean aggregate patent-filing count specific to Israeli cybersecurity was found — a genuine data gap, not evidence of low IP activity. AI-security-focused companies funded rose from 8 (2024) to 12 (2025), endpoint-security funding surged from 1 round in 2024 to 11 in 2025, and Torq's "AI SOC" positioning and Cyera's rapid pivot to "AI governance" reflect fast product-category creation rather than incremental iteration.
Defense Tech
This is the sector most directly reshaped by the ongoing conflict — the extended war has functioned as a live R&D and procurement accelerant rather than a headwind. Defense-tech and dual-use investment went from essentially a rounding error pre-2023 to Israel's fastest-growing category: about 800 startups are now fulfilling direct Defense Ministry procurement orders, and for the first time private investment in defense startups has surpassed government investment, per the Ministry itself. Growth is accelerating into 2026 — H1 2026 funding alone roughly tripled all of 2025's total.
- Notable companies: Xtend (AI-powered drone/robotic-swarm systems, Nasdaq listing at a $1.5B valuation); Kela (defense operating system integrating disparate military systems, $200M raised at a $1B valuation, unicorn status); AITAN (combat drone technology, $41M raised, expanding sales to allied nations); Skapion (autonomous air-defense systems countering drone swarms, $36M raised).
- Funding & valuations: Israeli defense-tech startups raised roughly $1B in 2025 (financings plus M&A combined) — exceeding all prior years combined — then roughly $3B in H1 2026 alone, about triple the full-year 2025 figure. Defense-tech and dual-use companies made up roughly 30% of Israel's total $8.4B in H1 2026 private tech investment; separately, the Ministry of Defense's own direct procurement orders to tech/startup suppliers reached ~$330M in a recent period, double the same period a year earlier.
- Government support: The Directorate of Defense R&D (MAFAT) runs the "Green Lane" program, fast-tracking startups and small suppliers into Ministry of Defense supplier status with simplified registration, IP retention, 30-day payment cycles, and a two-year ISO-certification exemption. In February 2025 the Ministry announced it will allocate a "double-digit percentage" of its overall R&D budget specifically to activities with startups and SMEs, on top of existing co-development pathways with the major primes (Rafael, Israel Aerospace Industries, Elbit Systems).
- Innovation & patents: No clean aggregate patent-filing count specific to Israeli defense-tech was found — a genuine data gap. Qualitative innovation signals are unusually strong: investor and startup activity is concentrated in newly emergent categories directly forged by 2023-2026 combat experience — frequency-control and GPS/drone-disruption systems, AI-driven autonomous target prioritization, encrypted battlefield cloud communications — described by sector investors as a "combat-tested, then commercialized" innovation cycle unique to this period.
Enterprise AI & SaaS
Enterprise software (including AI applications) was Israel's single largest funding category in 2025 by dollar volume — ahead even of cybersecurity — with momentum continuing into 2026 via mega-rounds for AI-agent platforms. This sector is also where AI's disruptive effect on Israeli tech is most visible from the inside: publicly traded monday.com cut 630 jobs in July 2026 as part of a restructuring explicitly built around AI agents, even as its AI-linked ARR was doubling. The war's effect here is more indirect than in cyber or defense — the 2025-2026 story is mainly global AI capital chasing Israeli technical talent.
- Notable companies: Decart (real-time generative video/"world model" AI, $300M from Nvidia at a $4B valuation, reportedly in talks to be acquired by Anthropic for ~$6B); Wonderful (enterprise AI agents across 35+ markets, $550M raised at a $5B valuation); AI21 Labs (enterprise-reliability foundation models/Maestro orchestration, $300M Series D backed by Google and Nvidia, $636M total funding); HiBob (HR-tech/SaaS for AI-agent workforce deployment, $166M raised led by Salesforce at a $3.5B valuation).
- Funding & valuations: Enterprise software (including AI applications) raised $4.5B in 2025, the largest single sector by dollars, ahead of cybersecurity's $4.1B. Cybersecurity plus generative AI combined accounted for roughly 70% of all 2025 Israeli tech capital across only ~40% of funding rounds — high concentration into fewer, larger AI/enterprise deals.
- Government support: The Knesset approved a new R&D Encouragement and Incentive Law effective from 2026, expanding tax incentives for R&D-intensive tech companies building on the existing "Preferred Enterprise" regime — directly relevant to AI/SaaS firms operating Israeli R&D centers. Broader, non-sector-specific support includes the Israel Innovation Authority's NIS 1 billion Fast-Track Funding Program and its continued ~$450M deployed into VC funds supporting the ecosystem.
- Innovation & patents: No clean aggregate patent-filing count specific to Israeli enterprise AI/SaaS was found — a genuine data gap. AI21's Maestro platform claims to lift instruction-following accuracy of models like GPT-4o and Claude by up to 50%, positioning it as a first-of-kind "orchestration layer" category; Decart's real-time generative-video technology drew acquisition interest from a frontier AI lab, unusual for an Israeli AI startup; and monday.com's agent-native restructuring is an early, concrete example of a SaaS incumbent re-architecting its delivery model around AI agents rather than headcount.
HealthTech & Digital Health
HealthTech is the one sector in this report where the ongoing conflict reads as a clear net drag rather than a tailwind: 2025 investment fell roughly 40% YoY, average deal size dropped below $10M for the first time in at least five years, and new company formation (67 in 2025) hit its lowest level since 2023, with industry voices citing geopolitical uncertainty, reserve-duty disruption to teams, and capital rotating toward cyber/defense/AI instead. The one clear bright spot is AI-enabled biomedical and drug-discovery work, which has stayed comparatively stable for three straight years.
- Notable companies: Aidoc (AI foundation-model platform for radiology workflow, additional $150M raised in 2025, ~$234M raised to date); Remepy (AI-driven Parkinson's disease treatment, $36M Series A, advancing toward Phase III); QuantHealth (AI-based clinical-trial simulation, $45M Series B); NVision (quantum-sensing MRI technology expanding into drug-development applications, $55M raised).
- Funding & valuations: Total Israeli health-tech investment was $1.6B in 2025, down ~40% from 2024 and less than half the $3.3B raised in 2022. Medical-device investment was hit hardest (down over 60%), while biomedical/AI-drug-discovery funding held comparatively stable. Healthcare recorded 152 funding rounds in 2025 — a record by deal count — even as total dollar volume fell.
- Government support: Israel approved a joint NIS 100 million (~$30M) three-year Digital Health Initiative — funded by the National Digital Health Plan, the Health Ministry, and the Israel Innovation Authority — to let hospitals share anonymized clinical data with startups; 19 of 30 submitted programs were approved, including major hospital data-sharing projects, with an initial NIS 40M tranche disbursed. The Israel Innovation Authority also runs a dedicated Regulatory Sandbox for Breakthrough AI Technologies in Healthcare.
- Innovation & patents: No clean aggregate patent-filing count specific to Israeli health-tech was found — a genuine data gap, especially given the sector's device- and drug-heavy IP profile. Aidoc's move to a foundation-model architecture for radiology imaging is described as a first-of-kind approach for that workflow category, NVision's quantum-sensing approach to MRI is a genuinely novel physical technique, and an Israeli AI-drug-discovery incubator startup secured direct backing from Pfizer, AstraZeneca, and Merck KGaA even as broader health-tech dollars contracted.
Fintech
Israeli fintech has historically been the country's #2 sector after cybersecurity, and 2025-2026 has been defined more by major exits and public-market events than by growth-stage mega-rounds: Xero's up-to-$3B acquisition of Melio and eToro's May 2025 IPO ($5.4B market cap) were the headline events, alongside continued crypto-infrastructure and payments build-out. A newer, smaller wave of AI-native fintech startups (agentic banking/lending, AI-automated insurance claims) is emerging in 2026 at much smaller check sizes than cyber or enterprise-AI rounds; the war appears to have hit this sector comparatively less than health-tech.
- Notable companies: Rapyd (cross-border payments/fintech-as-a-service, $500M raised at a $4.5B valuation to help fund its ~$610M PayU acquisition, a steep correction from a $15B secondary-market valuation reached in 2022); Fireblocks (digital-asset custody/infrastructure, last raised at an $8B valuation, recently partnered with Papaya Global on a real-time global payroll wallet); Melio (B2B payments processing over $30B annually for 80,000+ US SMBs, acquired by Xero for up to $3B); Datarails (AI-powered FP&A platform, $70M Series C at a $550M valuation).
- Funding & valuations: Israeli fintech attracted roughly 12% of total Israeli startup funding in 2024, the second-largest sector after cybersecurity, with its funding decline in that downturn (~-31%) notably smaller than the global fintech decline (~-39%) over the same period. 2025-2026 activity has skewed toward exit and public-market value creation (Melio's up-to-$3B sale, eToro's $5.4B-market-cap IPO) more than fresh VC mega-rounds; newer 2026 rounds are comparatively modest and AI-native.
- Government support: The Bank of Israel has continued a multi-year push to increase payment-system competition, including a 2026 expansion of the "identification code" payment-routing system aimed at opening the financial market to new entrants; a nascent AI regulatory sandbox framework for fintech/AI oversight is also under development. General Israel Innovation Authority grants and the new 2026 R&D Encouragement and Incentive Law extend the same R&D tax incentives available to other sectors to fintech firms operating Israeli R&D centers.
- Innovation & patents: No clean aggregate patent-filing count specific to Israeli fintech was found — a genuine data gap. Fireblocks and Papaya Global's real-time global payroll wallet is a first-of-kind product pairing crypto-custody infrastructure with payroll delivery, and a small cluster of 2026 "agentic fintech" launches — AI agents automating banking/lending workflows, AI-automated travel-insurance claims, AI-driven FP&A analysis — represent a distinct new product wave layered on top of Israel's more mature payments and crypto-infrastructure base.
Section 15
Cross-Regional Synthesis
Twelve patterns repeat across every region and sector covered in this report, regardless of geography:
- 1. The barbell is universal. Whether it's the US (mega-rounds vs. flat deal count), Europe (fewer, larger checks), Africa (debt filling the equity gap), or MENA (UAE dominance vs. Saudi collapse), every market in this report shows capital concentrating into fewer, larger bets while the broad base of company formation either shrinks or stagnates. This is not an AI-specific phenomenon — AI is simply where it's most visible.
- 2. Debt is the release valve. Africa (41% of tech capital), climate tech (~25% of H1 2026 funding), and rising private-credit interest in defense and infrastructure all point to debt quietly substituting for equity at the venture frontier. This changes the risk profile founders are taking on even when the funding headlines look like an equity boom.
- 3. Sovereignty and defense are converging into one thesis. The EU's sovereign-AI push, Israel's defense-tech repositioning, India's deep-tech policy overhaul, and the US defense-tech funding surge are, functionally, the same bet made in four different jurisdictions: that AI-and-hardware self-sufficiency is now a national-security and industrial-policy priority, not just a commercial one. Government first-loss capital is showing up everywhere as the catalytic layer underneath private rounds.
- 4. Exit value still lags exit volume outside the US. Europe's 37%-volume/11%-value gap is the clearest statement of this, but India's funding levels still well below 2021 peaks, and MENA's thin late-stage market (one Saudi swing moves the whole country's YoY number) tell the same story: company formation and early funding have recovered faster than the mechanisms that translate a good company into a large realized outcome. This is precisely the gap that cross-border market-access and validation models are built to close — a startup with real product-market fit in India, the EU, or the UAE increasingly needs deliberate help finding the market and the exit path where its value will actually be recognized, rather than assuming domestic success alone will get there.
- 5. Vertical, capital-efficient AI is quietly outperforming general-purpose AI. Legal tech and physical AI both show it explicitly (robotic foundation models: 1.78x capital efficiency vs. humanoids; legal research tools: disproportionate capital share on fewer deals) — the pattern likely generalizes to fintech, proptech, and legal-tech infrastructure plays built for a specific vertical rather than general-purpose tooling.
- 6. Enterprise adoption is running behind funding enthusiasm almost everywhere. Healthcare (2% of US health systems at full-scale gen-AI deployment), enterprise AI agents (roughly half operating without integration), and physical AI (early commercial deployment relative to funding velocity) all show the same lag. Funding velocity is a leading indicator of investor conviction, not a trailing indicator of proven deployment — worth remembering when reading any of the sector numbers in this report as a signal of near-term revenue rather than of longer-term technology conviction.
- 7. The market is pricing two entirely different assets under one label. A foundation-model lab at 30–120x revenue and an "AI-wrapped" application at 8–20x are not the same bet, even though both get called "AI startups" in the funding tables throughout this report. The premium belongs to infrastructure, proprietary models, and genuine workflow lock-in — not to the word "AI" in a pitch deck. Expect this distinction to become the dividing line in every regional market covered here as the cycle matures, including in India, the UAE, and Israel, where "AI-native" is currently used fairly loosely as a deal-share category.
- 8. Capital is no longer the binding constraint — power, chips, and regulation are. The circular-financing structure underneath the largest AI deals (Section 7.3, 8.1), the physical grid-capacity ceiling on data-center buildout (Section 8.3), export-control blocs reorganizing chip access around geopolitical alignment (Section 8.4), and the EU AI Act's compliance costs and relocation effect (Section 8.5) all point the same direction: the next phase of this cycle is gated by physical infrastructure, geopolitics, and regulation, not by whether investors are willing to write checks. That is a genuinely different set of risks than the ones that ended the 2021 cycle, and worth underwriting explicitly rather than assuming this correction, if it comes, will look like the last one.
- 9. The barbell starts at the very first funding rung, not just at the top. YC batch sizes shrinking into a narrower, more concentrated cohort (Section 9.4) and San Francisco's YC share rising from 21% to 73% in five years show the same concentration pattern documented in mega-rounds (Section 1.1) already operating at the earliest, smallest-check stage of the pipeline. This suggests the barbell isn't a late-stage distortion sitting on top of a healthy broad base — the base itself has been narrowing for several years, which is a more structural problem than "there's too much AI money" implies.
- 10. Pledged capital and deployed capital are different things, everywhere. The Gulf-into-India case (Section 9.6) — $1.7B actually deployed against $100B+ in standing pledges — is the clearest documented instance in this report, but the same gap almost certainly exists wherever a headline capital commitment (a national AI fund, a diaspora investment initiative, a sovereign pledge) gets reported as if it were already at work. Treat any pledge, fund-of-funds commitment, or announced strategic partnership in this report — or in any pitch that cites one — as a ceiling on what might arrive, not a floor on what has.
- 11. "Startup funding" is not one market, and the real economy isn't riding the AI wave uniformly. Agritech funding fell 16% in 2025 and needed one mega-round to look flat in 2026; India's D2C sector has contracted for three straight years; industrial robotics funding is a record headline number sitting on top of an industry that openly doubts whether the flagship humanoid use case actually works in production yet (Section 11.2). At the same time, AI-native tooling is visibly spreading from pure software into hard, regulated, physical sectors — mining exploration, agricultural biologicals, grid and nuclear siting, insurance underwriting — where it rewards vertical specificity over general-purpose tools, echoing pattern 5 one layer down. The honest picture is a two-speed economy: a narrow band of AI infrastructure and AI-native software setting every record in this report, and most of the rest of the real economy — agriculture, consumer goods, traditional industrials — recovering slowly or not at all. Reading only the AI numbers would miss that second, larger reality entirely.
- 12. The deployment clock and the returns clock are running at completely different speeds. Every funding figure in this report (Section 1) measures money going into companies, which is at or near record levels almost everywhere. Section 12 measures money coming back to the people who funded the funds — and by that clock, the 2021 vintage has returned $8 for every $100 committed, five years in, and fewer than a quarter of 2021-vintage funds have distributed anything at all. A booming deployment year and a starved distribution environment are not contradictory; they're two different parts of the same cycle, and conflating them — reading fast deployment as proof the asset class is healthy — is probably the single easiest mistake to make with everything else in this report.
Section 16
Appendix: Full Sector Taxonomy Cross-Reference
Section 11 covers the real-economy and remaining sectors a pure AI-trends lens usually misses, using the screener.in industry taxonomy for Indian listed equities (191 individually named industries) as a checklist. This appendix makes that checklist fully auditable rather than asserted: every one of the 191 industries is listed below with an explicit status, so a reader can verify item-by-item that nothing was quietly skipped.
- COVERED (22 industries): the category has its own dedicated subsection somewhere in this report.
- ADJACENT (53 industries): the category folds into a covered section as a named example, sub-case, or closely related activity — it is addressed, but not as a standalone heading.
- NO VC (101 industries): a genuinely large part of the taxonomy — these are structurally non-venture-funded categories: mature public-market incumbents, commodities, or capital-intensive infrastructure businesses financed through private equity, corporate balance sheets, or public markets rather than venture capital. Their absence from the venture-funding narrative is a real finding about how the economy is financed, not a coverage gap in this report.
- GAP (15 industries): categories with real, ongoing venture activity that this report has not yet researched — named explicitly rather than folded silently into "no venture activity." They are: Advertising & Media Agencies, Auto Dealer, Civil Construction, Depositories/Clearing Houses & Exchange and Data Platform infrastructure, Digital Entertainment / Electronic Media / Film Production / Television Broadcast / Media & Entertainment (one connected streaming, broadcast, and creator-economy cluster), Other Capital Market related Services, Seafood, Shipping, Waste Management, and Water & Sewage Treatment. These are the natural next additions if this taxonomy pass is extended further.
Table 16.1 — every screener.in industry (191) cross-referenced against this report's coverage.
| Screener.in Industry | Status | Where covered / why not |
|---|---|---|
| 2/3 Wheelers | ADJACENT | 11.3 Automotive, EV & AV — micromobility (Also/Rivian spin-out) |
| Abrasives & Bearings | NO VC | Mature industrial-component manufacturing, public-market/commodity |
| Advertising & Media Agencies | GAP | Ad-tech / retail-media / creator-monetization tooling not covered — genuine remaining gap |
| Aerospace & Defense | COVERED | 2.3 Defense Tech; 11.11 Space Tech |
| Airline | NO VC | Capital-intensive, incumbent-dominated; airline operators themselves are not VC-funded (travel booking/PMS layer is 11.16) |
| Airport & Airport services | NO VC | Infrastructure, public/PE-financed |
| Aluminium | NO VC | Commodity metal, public markets |
| Aluminium, Copper & Zinc Products | NO VC | Commodity, downstream metals |
| Amusement Parks/ Other Recreation | NO VC | Mature incumbent/PE-financed leisure assets |
| Animal Feed | ADJACENT | 11.1 AgriTech — animal-health & feed-optimization tech |
| Asset Management Company | ADJACENT | 5.1 Fintech / 11.6 InsurTech & capital-markets infrastructure |
| Auto Components & Equipments | NO VC | Mature manufacturing; EV-specific components adjacent to 11.3 |
| Auto Dealer | GAP | Auto-retail marketplace tech not covered — minor gap |
| Biotechnology | COVERED | 5.4 HealthTech & Biotech; 11.13 Longevity & Biotech Beyond Digital Health |
| Breweries & Distilleries | NO VC | Mature consumer/incumbent (craft D2C beverage is a minor unaddressed niche) |
| Business Process Outsourcing (BPO)/ Knowledge Process Outsourcing (KPO) | NO VC | Mature services category |
| Cables - Electricals | NO VC | Commodity/industrial |
| Carbon Black | NO VC | Commodity chemical |
| Castings & Forgings | NO VC | Commodity industrial manufacturing |
| Cement & Cement Products | NO VC | Explicitly named in 11.20 as structurally non-venture |
| Ceramics | NO VC | Commodity/industrial |
| Cigarettes & Tobacco Products | NO VC | Explicitly named in 11.20 as structurally non-venture |
| Civil Construction | GAP | Construction-tech is adjacent to 5.3 PropTech, but civil/infra construction itself is not VC-heavy — thin coverage |
| Coal | NO VC | Legacy energy, public markets |
| Commercial Vehicles | ADJACENT | 11.3 Automotive — Slate Auto, DeepWay trucks |
| Commodity Chemicals | NO VC | Commodity, public markets |
| Compressors, Pumps & Diesel Engines | NO VC | Mature industrial manufacturing |
| Computers - Software & Consulting | COVERED | Throughout Section 2 and 5.5 Enterprise AI & Coding Agents |
| Computers Hardware & Equipments | ADJACENT | 2.4 Semiconductors & compute infrastructure |
| Construction Vehicles | NO VC | Mature industrial manufacturing |
| Consulting Services | NO VC | Mature professional-services category |
| Consumer Electronics | ADJACENT | Section 2 hardware trends — thin, mostly incumbent-dominated |
| Copper | NO VC | Commodity; critical-minerals angle covered in 11.4 Mining |
| Dairy Products | ADJACENT | 11.1 AgriTech, loosely |
| Data Processing Services | ADJACENT | Enterprise AI / data-infrastructure trends (Section 2) |
| Dealers-Commercial Vehicles, Tractors, Construction Vehicles | NO VC | Mature dealer/distribution category |
| Depositories, Clearing Houses and Other Intermediaries | GAP | Capital-markets infrastructure already flagged as a data gap in 11.6 |
| Digital Entertainment | GAP | Streaming/OTT/creator-economy tech not covered — genuine remaining gap |
| Distributors | NO VC | Generic trade/logistics incumbent category |
| Diversified | NO VC | Holding-company category, named in 11.20 |
| Diversified Commercial Services | NO VC | Mature services |
| Diversified consumer products | ADJACENT | 11.9 Consumer, D2C & Retail |
| Diversified FMCG | NO VC | Named in 11.20 (household/personal products) |
| Diversified Metals | NO VC | Commodity; adjacent to 11.4 Mining |
| Diversified Retail | ADJACENT | 11.14 E-Commerce, Quick-Commerce & Social Commerce / 11.9 D2C |
| Dredging | NO VC | Heavy infrastructure, incumbent-dominated |
| Dyes And Pigments | NO VC | Commodity chemical |
| E-Learning | COVERED | 11.12 EdTech |
| E-Retail/ E-Commerce | COVERED | 11.14 E-Commerce, Quick-Commerce & Social Commerce |
| Edible Oil | NO VC | Commodity/FMCG |
| Education | COVERED | 11.12 EdTech |
| Electrodes & Refractories | NO VC | Commodity industrial |
| Electronic Media | GAP | Same gap as Digital Entertainment |
| Exchange and Data Platform | GAP | Fintech market infrastructure — flagged as a data gap in 11.6 |
| Explosives | NO VC | Commodity/industrial, heavily regulated |
| Ferro & Silica Manganese | NO VC | Commodity metal |
| Fertilizers | ADJACENT | 11.1 AgriTech — agricultural biologicals (Synthesis point 11) |
| Film Production, Distribution & Exhibition | GAP | Same gap as Digital Entertainment |
| Financial Institution | ADJACENT | 5.1 Fintech (disruptors); incumbent banks themselves are NO VC |
| Financial Products Distributor | ADJACENT | 5.1 Fintech |
| Financial Technology (Fintech) | COVERED | 5.1 Fintech — extensively, plus regional deep dives throughout Section 14 |
| Footwear | ADJACENT | 11.9 Consumer, D2C & Retail |
| Forest Products | NO VC | Named in 11.20 (paper/forest products) |
| Furniture, Home Furnishing | ADJACENT | 11.9 Consumer, D2C & Retail, loosely |
| Garments & Apparels | ADJACENT | 11.9 D2C / 11.20 (textiles named as structurally non-venture) |
| Gas Transmission/Marketing | NO VC | Legacy energy infrastructure |
| Gems, Jewellery And Watches | COVERED | 11.17 Gems, Jewellery, Watches & Lab-Grown Diamond Tech (watches specifically remains a data gap within this section) |
| General Insurance | COVERED | 11.6 InsurTech & Capital Markets Infrastructure |
| Glass - Consumer | NO VC | Commodity |
| Glass - Industrial | NO VC | Commodity |
| Granites & Marbles | NO VC | Commodity/construction materials |
| Healthcare Research, Analytics & Technology | COVERED | 5.4 HealthTech & Biotech |
| Healthcare Service Provider | COVERED | 5.4 HealthTech & Biotech |
| Heavy Electrical Equipment | ADJACENT | 11.5 Energy: Grid, Storage & Nuclear |
| Holding Company | NO VC | Named in 11.20 |
| Hospital | ADJACENT | 5.4 HealthTech — delivery side |
| Hotels & Resorts | COVERED | 11.16 Travel & Hospitality Tech |
| Household Appliances | NO VC | Mature consumer durables |
| Household Products | NO VC | Named in 11.20 |
| Houseware | NO VC | Mature consumer category |
| Housing Finance Company | ADJACENT | 5.1 Fintech / 5.3 PropTech |
| Industrial Gases | NO VC | Commodity |
| Industrial Machinery | ADJACENT | 11.2 Industrial Robotics & Manufacturing Automation |
| Industrial Minerals | ADJACENT | 11.4 Mining, Metals & Critical Minerals |
| Industrial Products | NO VC | Generic/mature category |
| Insurance Distributors | ADJACENT | 11.6 InsurTech |
| Integrated Power Utilities | ADJACENT | 11.5 Energy: Grid, Storage & Nuclear |
| Internet & Catalogue Retail | COVERED | 11.14 E-Commerce, Quick-Commerce & Social Commerce |
| Investment Company | NO VC | Holding/PE structure, not itself VC-funded |
| Iron & Steel | NO VC | Commodity, named in 11.20's expanded list |
| Iron & Steel Products | NO VC | Commodity |
| IT Enabled Services | ADJACENT | Enterprise AI / BPO-adjacent trends |
| Jute & Jute Products | NO VC | Named in 11.20 |
| Leather And Leather Products | NO VC | Mature manufacturing (D2C leather goods loosely adjacent to 11.9) |
| Leisure Products | NO VC | Mature consumer category |
| Life Insurance | COVERED | 11.6 InsurTech |
| Logistics Solution Provider | ADJACENT | 11.14/11.15 delivery logistics; Africa/India logistics in Section 14 |
| LPG/CNG/PNG/LNG Supplier | NO VC | Legacy energy infrastructure |
| Lubricants | NO VC | Commodity |
| Meat Products including Poultry | ADJACENT | 11.1 AgriTech — animal health |
| Media & Entertainment | GAP | Same gap as Digital Entertainment |
| Medical Equipment & Supplies | COVERED | 5.4 HealthTech & Biotech |
| Microfinance Institutions | ADJACENT | 5.1 Fintech; Africa mobile money (6.5, 14.5) |
| Multi Utilities | ADJACENT | 11.5 Energy: Grid, Storage & Nuclear |
| Non Banking Financial Company (NBFC) | ADJACENT | 5.1 Fintech |
| Offshore Support Solution Drilling | NO VC | Legacy oil & gas services |
| Oil Equipment & Services | NO VC | Legacy energy |
| Oil Exploration & Production | NO VC | Legacy energy, public markets |
| Oil Storage & Transportation | NO VC | Legacy energy infrastructure |
| Other Agricultural Products | ADJACENT | 11.1 AgriTech |
| Other Bank | NO VC | Incumbent banking |
| Other Beverages | ADJACENT | 11.9 Consumer, D2C & Retail |
| Other Capital Market related Services | GAP | Flagged as a data gap in 11.6 |
| Other Construction Materials | NO VC | Named in 11.20 |
| Other Consumer Services | ADJACENT | 11.9 / 11.14 |
| Other Electrical Equipment | NO VC | Mature industrial |
| Other Financial Services | ADJACENT | 5.1 Fintech |
| Other Food Products | ADJACENT | 11.1 AgriTech / 11.9 D2C |
| Other Industrial Products | NO VC | Generic/mature category |
| Other Telecom Services | ADJACENT | 11.7 Satellite, Telecom & Connectivity — mostly flagged there as thin/mature |
| Other Textile Products | NO VC | Named in 11.20 |
| Packaged Foods | ADJACENT | 11.9 Consumer, D2C & Retail |
| Packaging | COVERED | 11.18 Packaging & Sustainable Materials |
| Paints | NO VC | Commodity/industrial |
| Paper & Paper Products | NO VC | Named in 11.20 |
| Passenger Cars & Utility Vehicles | ADJACENT | 11.3 Automotive, EV & AV |
| Personal Care | ADJACENT | 11.9 D2C / 11.20 household-personal products |
| Pesticides & Agrochemicals | ADJACENT | 11.1 AgriTech — agricultural biologicals |
| Petrochemicals | NO VC | Commodity, public markets |
| Pharmaceuticals | ADJACENT | 5.4 HealthTech/Biotech covers AI drug discovery; generic pharma manufacturing itself is NO VC |
| Pharmacy Retail | ADJACENT | 5.4 HealthTech — digital pharmacy is thin, mostly a mature retail category |
| Pig Iron | NO VC | Commodity |
| Plastic Products - Consumer | ADJACENT | 11.18 Packaging — plastic-alternative angle; bulk of category is NO VC |
| Plastic Products - Industrial | NO VC | Commodity |
| Plywood Boards/ Laminates | NO VC | Commodity/forest products |
| Port & Port services | NO VC | Infrastructure, incumbent-dominated |
| Power - Transmission | ADJACENT | 11.5 Energy: Grid, Storage & Nuclear |
| Power Distribution | ADJACENT | 11.5 Energy: Grid, Storage & Nuclear |
| Power Generation | ADJACENT | 11.5 Energy: Grid, Storage & Nuclear (nuclear specifically) |
| Power Trading | NO VC | Mature market infrastructure |
| Precious Metals | ADJACENT | 11.4 Mining (bullion, flagged as data gap) / 11.17 Gems & Jewellery (gold-tech) |
| Print Media | NO VC | Named in 11.20 (printing & publication) |
| Printing & Publication | NO VC | Explicitly named in 11.20 as structurally non-venture |
| Printing Inks | NO VC | Commodity |
| Private Sector Bank | NO VC | Incumbent banking (disruptor fintech covered in 5.1) |
| Public Sector Bank | NO VC | Incumbent banking |
| Railway Wagons | NO VC | Mature industrial/public infrastructure |
| Ratings | NO VC | Mature incumbent category (Moody's/S&P-style); no venture data found |
| Real Estate Investment Trusts (REITs) | ADJACENT | 5.3 PropTech — tokenized real estate; REITs themselves are a public-market structure |
| Real Estate related services | COVERED | 5.3 PropTech & Real Estate Tech |
| Refineries & Marketing | NO VC | Legacy energy |
| Residential, Commercial Projects | ADJACENT | 5.3 PropTech; development itself is a PE/incumbent category |
| Restaurants | COVERED | 11.15 Food Delivery, Cloud Kitchens & Restaurant Tech |
| Road Assets—Toll, Annuity, Hybrid-Annuity | NO VC | Infrastructure, PE-financed |
| Road Transport | ADJACENT | Logistics (11.14/11.15); trucking itself is mostly NO VC |
| Rubber | NO VC | Commodity |
| Salt | NO VC | Commodity |
| Sand | NO VC | Commodity |
| Seafood | GAP | Aquaculture technology thinly adjacent to 11.1 AgriTech — not separately researched |
| Seeds | ADJACENT | 11.1 AgriTech — genomics-driven seed/biologicals startups (noted directionally, not separately sized) |
| Semiconductors | COVERED | 2.4 Semiconductors & Quantum Computing; referenced throughout Section 11 and 14 |
| Shipping | GAP | Maritime-logistics tech thinly adjacent to 11.14/11.15 — not separately researched |
| Specialty Chemicals | ADJACENT | 11.8 Materials Science & Specialty Chemicals |
| Specialty Steel | NO VC | Commodity |
| Spices | NO VC | Commodity/agri, thin |
| Sugar | NO VC | Commodity |
| Sulfuric Acid & Fertilizer Intermediates | NO VC | Commodity chemical |
| Surgical Instruments & Medical Devices | COVERED | 5.4 HealthTech & Biotech |
| Synthetic Fibers | NO VC | Named in 11.20 (textiles) |
| Tannery | NO VC | Commodity/mature manufacturing |
| Tea & Coffee | NO VC | Commodity/agri (D2C coffee brands are a minor unaddressed niche) |
| Telecom - Wireless | ADJACENT | 11.7 Satellite, Telecom & Connectivity — flagged there as mature/incumbent-dominated |
| Telecom Equipment | NO VC | Flagged in 11.7 as mature, incumbent-dominated |
| Television Broadcast | GAP | Same gap as Digital Entertainment |
| Textiles - Natural Fiber | NO VC | Named in 11.20 |
| Textiles - Synthetic Fiber | NO VC | Named in 11.20 |
| Tires & Tubes | NO VC | Commodity/mature manufacturing |
| Tobacco | NO VC | Named in 11.20 |
| Trading | NO VC | Generic commodity-trading category |
| Tractors | ADJACENT | 11.1 AgriTech — farm automation |
| Transport Equipment | NO VC | Mature manufacturing |
| Tubes, Pipes & Fittings | NO VC | Commodity |
| Vegetable Oils | NO VC | Commodity |
| Venture Capital & Private Equity | COVERED | Section 12, VC Fund Performance & the LP Side |
| Veterinary Products | COVERED | 11.19 Pet Care & Veterinary Tech |
| Waste Management | GAP | Loosely climate-tech-adjacent (2.5) but recycling/waste-tech not separately researched |
| Water & Sewage Treatment | GAP | Water-tech is a real VC category not separately researched in this report |
| Water Supply | NO VC | Infrastructure/utility incumbent |
| Wires & Cables | NO VC | Commodity |
| Wool & Woolen Products | NO VC | Named in 11.20 (textiles) |
| Yarn | NO VC | Named in 11.20 (textiles) |
Methodology: screener.in "Industries Overview" (screener.in/market/), cross-referenced against every section of this report, September 2026. COVERED = dedicated subsection; ADJACENT = folds into a covered category; NO VC = structurally non-venture-funded; GAP = real venture activity not yet researched here.
Reference
Sources
All figures current as of early-to-mid September 2026. Where a source reports a range or a preliminary figure, this report notes it as such in the text.
- KPMG Private Enterprise, "Venture Pulse" — Global VC investment Q1 2026
- Crunchbase News / AI Weekly — US Venture H1 2026 ($412.7B, AI 86% share)
- Crunchbase News — Europe Q1 2026 AI-led funding
- Startup Genome — Global Startup Ecosystem Report 2026 (Europe: resilience, reorientation, reform)
- Wamda — MENA Startup Funding H1 2026
- Arab News / Economy Middle East — UAE / MENA Q1–H1 2026 funding data
- Rio Times / Partech Africa — African Startup Funding 2025–26
- Tekedia — Africa Fintech & Logistics H1 2026 sector breakdown
- Jerusalem Post / Startup Nation Central — Israeli High-Tech H1 2026 report
- Value Add VC — India, MENA, Africa, Defense Tech and IPO Pipeline 2026 analyses
- Finval Research / 21By72 / UpForge — India Startup Funding 2026 reports
- Digitimes / PSA (Government of India) — National Deep Tech Startup Policy Framework
- New Market Pitch — Physical AI, Legal AI, Defense Tech, Semiconductor, Quantum Computing funding trackers
- Crunchbase News — Defense Tech, Semiconductor, and Quantum Computing sector snapshots (2026)
- Net Zero Insights — Climate Tech H1 2026 market report
- Distilled Funding — Emerging Fintech Trends 2026
- Qubit Capital — PropTech Investment Landscape 2026
- ReferralMD — US Healthtech Venture Capital Trends 2026
- CoinDesk / Silicon Valley Bank — 2026 Crypto & Stablecoin Integration Trends
- European Commission — Strengthening Europe's Tech Sovereignty (2026); EU Inc. / 28th Regime
- Value Add VC — AI Startup Valuation Multiples 2026 (foundation models vs. SaaS)
- Luminix / AI Tool Discovery — AI Capex vs. Revenue Gap analyses, 2026
- ComputeForecast — AI Circular Financing Deals and Systemic Risk, 2026
- Crunchbase News — Q1 2026 Venture Capital Concentration data
- Spheron Network — AI Data Center Power Constraints, 2026
- Silicon Valley Bank / Counterpart Ventures — State of Corporate Venture Capital
- Quoroom — Pre-IPO Secondaries and the Rise of the Secondary SPV, 2026
- TechChannel News — Capex, Chips, and Geopolitics: Semiconductor Value Chain, 2026
- Chargebee — Selling Intelligence: The 2026 Playbook for Pricing AI Agents
- Value Add VC — EU AI Act in 2026: What It Means for Startups
- Causo Hub — Down Rounds and Bridge Financing, 2026 (Carta / Cooley data)
- Axis Intelligence — Startup Failure Rate Statistics 2026 (BLS cohort data)
- StealthAgents Research — Startup Burn Rate & Runway Benchmarks 2026 (Carta / Kruze Consulting)
- EquityZen — The State of Female Founders in 2026
- Ellenox — Y Combinator Statistics and Insights 2026
- Crunchbase News — 2026 M&A Outlook and Predictions
- AGBI — Gulf Funds Recast Venture Capital as Strategic Pillar, 2026
- Global SWF (via Enterprise MENA+) — Gulf Sovereign Capital Into India: Pledges vs. Deployment, 2026
- African Business — Mobilising Africa's Diaspora for Investment, 2026
- New Market Pitch — AgriTech, InsurTech Funding Trends 2026
- Crunchbase News — Robotics Startup Venture Funding 2026; EV Funding Snapshot 2026
- Manufacturing Dive — Humanoid Hype vs. State of Industrial Robots, 2026
- Axios — Nuclear Energy Venture Capital, 2026
- VCBacked — Mining Technology Startup Directory, 2026
- Seedtable — Best Communications Satellite Startups, 2026
- Net Zero Insights — Startups Reshaping Specialty Chemical Supply Chains
- Business Standard / Tracxn — India D2C Segment Funding Trends, 2024–2026
- Crunchbase News — Cybersecurity Startup Funding H1 2026; Space Tech Startup Funding 2026
- Tech Times / Value Add VC — Space Tech Funding Record $20.3B, 2026
- HolonIQ — Global EdTech Venture Capital, H1 2026
- Rest of World — EdTech's Pandemic Boom Is Over: K-12 Startup Funding Craters, 2026
- LabIQ / We Will Cure / Longevity Investors News — Longevity Biotech Capital Flow, 2026
- Carta — VC Fund Performance, Q1 2026
- Value Add VC — VC Fund Performance Benchmarks 2026: IRR, TVPI, DPI by Vintage Year
- Eqvista — Global Dry Powder Levels 2026 (PE, VC & Private Credit)
- IndiaAI Mission / Digital India (MeitY) — Compute Subsidy and Startup Support Programs, 2026
- PIB / Government of India — Digital Agriculture Mission, PLI Auto Scheme, IN-SPACe Authorizations, Space Sector VC Fund
- Business Standard / Entrackr / Inc42 — India Fintech, Agritech, EV and Spacetech Funding Reports, 2025-2026
- Crunchbase News — Foundational AI, Defense Tech, Fintech, and Climate Tech Funding Snapshots, Q1 2026
- White House / CSIS — The Genesis Mission: AI-for-Science Executive Order, 2025-2026
- Rock Health / Fierce Healthcare — Digital Health Funding Year in Review, 2025
- Latham & Watkins / DOE — One Big Beautiful Bill Act Clean Energy Rollback Analysis, 2025
- Vestbee / Dealroom — Europe's Defence and Resilience Startup Funding, 2025-2026
- European Commission / Consilium — European Defence Industry Programme, InvestAI, EU Chips Act, 2025-2026
- EPO — Technology Dashboard and 2025 Patent Index
- Sifted / TechCrunch — European Quantum Computing and Semiconductor Funding, 2025-2026
- Wamda / MAGNiTT — MENA Fintech, PropTech, Logistics and Clean Energy Funding Reports, 2025-2026
- Dubai Land Department / REGA — Real Estate Tokenisation Project and Saudi PropTech Hub
- GAMI / Ministry of Defense (UAE, Saudi Arabia) — Defense Localization and Sovereign Industrial Programs, 2025-2026
- Techinafrica / Partech / TechCabal — African Fintech, Agritech, CleanTech and Logistics Funding by Sector, 2025-2026
- AfDB / Mission 300 — African Energy and Agricultural Technology Transformation Programs
- CareCity / Techpoint Africa — African Digital Health Funding Trends, 2025
- Calcalist / Times of Israel / Jerusalem Post — Israeli Cybersecurity, Defense Tech, Enterprise AI, HealthTech and Fintech Funding, 2025-2026
- Israel Ministry of Defense / DDR&D (MAFAT) — Green Lane Program and Startup R&D Budget Allocation
- PitchBook / Yahoo Finance — Global E-Commerce Startup Funding Collapse, 2025; TechCrunch / CNBC — Zepto Funding and IPO Filing, 2025-2026
- Tubefilter / CNBC — Whatnot Live-Shopping Funding Rounds, 2025-2026; ONDC (DPIIT) — Open Network for Digital Commerce
- PitchBook — Q3 2025 Foodtech VC Trends Report; CNBC / BusinessWire — DoorDash-Deliveroo Acquisition, 2025
- Inc42 — Rebel Foods and Swiggy Funding/Financial Updates, 2025-2026; Medianama — India Labour Codes Gig-Worker Provisions, 2025
- Remote Work Europe — EU Platform Work Directive (2024/2831) Transposition Tracker, 2026
- PhocusWire / Phocuswright — Travel Startup Funding Reports, 2025-2026; Hospitality Net — Hospitality Tech Funding, 2025-2026
- Inc42 — OYO/PRISM IPO Filing and Financials, 2025-2026; Saudi Standard / GTR Magazine — Saudi Tourism Development Fund and PIF Tourism Strategy
- Third Eyesight — India Lab-Grown Diamond Startup Funding, 2025; YourStory / Inc42 — Aukera, GIVA, Jewelbox, BlueStone Funding and IPO Filings
- DMCC — UAE Lab-Grown Diamond Vertical and Trade Data, 2025-2026; GJEPC — India Gem & Jewellery Trade Reports, 2025-2026
- Supply Change Capital — Sustainable Packaging Venture Funding Analysis, 2016-2025; European Commission — Packaging and Packaging Waste Regulation (2025/40)
- Inc42 — Bambrew Funding and India Packaging Market Sizing, 2025; Packaging Gateway — MENA/Africa Packaging Regulation Wave, 2025
- GlobalPETS / Crunchbase News — Global Pet Industry and Pet-Tech Venture Funding, 2025; Happy Pet — India Pet-Tech Startup Funding Roundup, 2025
- USDA/NIFA — Veterinary Services Grant Program Awards, 2025
- PitchBook — US Unicorn Devaluation Tracker, 2026 (via CNBC/RocketNews/Business Model Analyst syndication); Khosla Ventures — Samir Kaul commentary on engineering-team efficiency, 2026
- Development Corporate — "State of Seed" Winter 2025 Report; Revelio Labs — Startup Hiring & Series-A Capital-per-Employee Analysis, 2025; Harvard/INSEAD — AI-Native Startup Headcount and Capital Deployment Study (~50,000 YC/PitchBook companies), 2025-2026